BOJ Shifts Gears: Ueda Guides Economy Toward Normalization Amid Shifting Geopolitical Sands


In the semi-annual monetary review submitted to the National Diet, Bank of Japan Governor Kazuo Ueda detailed a defining chapter in the nation’s modern economic history. Covering the second half of fiscal year 2025 (October 2025 through March 2026), the comprehensive report chronicles the central bank’s decision to peel back decades of historic monetary accommodation. Moving decisively during its December 2025 Policy Board meeting, the BOJ implemented a 25-basis-point increase, lifting its benchmark overnight call rate from 0.5% to 0.75%.
The comprehensive report portrays an economy breaking free from its long-standing "deflationary norm," driven by robust corporate profitability, an increasingly tight labor market, and consecutive years of aggressive wage hikes achieved during consecutive spring labor offensives (Shunto). However, this transition toward normalization was far from smooth. Japanese policymakers found themselves charting a course through a shifting gauntlet of global macroeconomic shocks—ranging from defensive trade posturing and tariff escalations by the United States to a severe, late-horizon geopolitical crisis in the Middle East that sent crude oil prices soaring and triggered global risk-off behavior across international asset markets.
While domestic consumer demand exhibited mild friction under the weight of heightened food costs and shifting energy subsidies, the BOJ’s underlying message remains clear: Japan’s wage-price virtuous circle is establishing structural traction. Even with the rate hike, though, the central bank maintains that real interest rates remain deeply negative, ensuring a highly supportive financial environment for sustained corporate expansion.
Section 1: The Macroeconomic Landscape — Domestic Real Economy
1.1 Aggregate Economic Activity and Growth Trajectory
During the second half of fiscal year 2025, the Japanese economy maintained a trajectory of gradual macroeconomic recovery, demonstrating resilience despite encountering structural headwinds and soft patches both at home and abroad. Real Gross Domestic Product (GDP) recorded a net expansion during the fiscal second half relative to the preceding first half, successfully recovering from a temporary technical contraction observed in the July-September 2025 quarter. That prior dip was fundamentally diagnosed as a statistical distortion caused by a sharp unwinding of "front-loaded" or anticipatory export surges that had occurred earlier in the year ahead of projected trade barriers.
1.2 Corporate Profitability and the Industrial Sector
Japan’s industrial baseline operated under contrasting forces during the review period. The industrial landscape was heavily influenced by the implementation of expanded, sector-specific tariff structures by the United States. This trade friction directly impacted export profit margins within key sectors of Japanese heavy manufacturing, most notably auto manufacturers and industrial capital goods producers.
Despite these regulatory hurdles, aggregate corporate profits across all industries remained near historic highs. Firms successfully offset export margin compression through steady progress in passing accumulated costs down to output prices and capitalizing on strong global demand for high-tech inputs.
According to the Bank of Japan’s Short-Term Economic Survey of Enterprises (Tankan), business sentiment across corporate Japan remained broadly favorable. The Business Conditions Diffusion Index (DI) for large manufacturers expanded its positive margin over the period, buoyed by the continuous expansion of high-tech demand and an easing of early-stage anxieties regarding global trade negotiations. Non-manufacturing firms mirrored this upbeat sentiment; their corporate DI sustained an elevated horizontal plateau, backed by durable domestic demand and systematic service-sector price adjustments.
1.3 Industrial Production, Shipments, and Inventory Dynamics
Industrial output and mining production trended flat on an aggregate, smoothed basis, though significant divergence emerged across major sub-sectors.
- Transportation Equipment: The automotive assembly and transport components sector posted clear gains, supported by durable underlying demand across North American and continental European markets. Production volumes were further bolstered as domestic manufacturers successfully resolved localized parts shortages and stabilized factory assembly lines.
- Electronic Components and Devices: Production growth within the electronic components and semiconductor industries experienced a notable deceleration. While steady infrastructure outlays for artificial intelligence (AI) computing architectures acted as a structural floor, output was weighed down by a cyclical peak in hardware component processing for next-generation smartphone rollouts.
- Inventory Trends: Industrial inventories declined as shipments outpaced conservative factory projections. This de-stocking process was accelerated by steady demand for advanced technology goods and an ongoing inventory optimization cycle across domestic producers of capital and intermediate goods.
1.4 Fixed Capital Investment and R&D Allocations
Backed by robust corporate income statements and favorable Tankan capital expenditure (CapEx) metrics, private non-residential investment maintained a clear expansionary trend. Private enterprises actively expanded their capital budgets, driven by acute domestic labor constraints that necessitated capital-for-labor substitution through automated software and machine architectures. CapEx structural growth was further sustained by:
- High-priority investments aimed at accelerating digital transformation (DX) initiatives.
- Expanded spending on low-carbon enterprise structures and green energy technologies.
- Strategic corporate allocations focused on reinforcing domestic supply chain security.
While trade policy shifts occasionally induced a cautious watch-and-see attitude that slowed the execution rate of major outlays, corporate Japan's long-term investment stance remained firmly committed to modernization.
1.5 Residential Construction and Public Works
In contrast to commercial fixed investment, private residential investment entered a broader structural contraction. While the headline GDP metric for residential construction posted a modest rebound relative to the first half—largely due to a temporary recovery from a drop that followed regulatory updates to the Building Standards Act—underlying leading indicators painted a weaker picture. Housing starts pointed steadily downward through the end of the fiscal year. This decline was attributed to persistent inflation in construction materials, rising structural labor costs, and long-term demographic challenges facing regional housing markets.
Meanwhile, public infrastructure outlays tracked flat. Government spending maintained a steady horizontal baseline as construction funding moved forward into active construction pipelines for national land resilience initiatives.
Section 2: Labor Dynamics and Consumption
2.1 Labor Market Tightness and Institutional Supply Boundaries
The structural baseline of Japan's labor market was defined by persistent labor scarcity. The Tankan Employment Conditions DI recorded severe, structural "insufficient" readings across virtually all commercial sectors, with labor shortages especially pronounced inside contact-intensive domestic service industries. The headline unemployment rate remained near cyclical lows, fluctuating within a tight structural band.
Central bank analysts noted that institutional boundaries for labor supply are tightening. Historically elastic sources of secondary labor supply—most notably women and elderly workers entering the workforce—approached structural peaks, signaling that future domestic employment growth will depend on increasing productivity per hour.
2.2 Wage Trends and Total Labor Compensation
Driven by acute recruitment challenges and institutional support from consecutive spring labor campaigns, nominal labor compensation maintained a steady upward trajectory:
- Scheduled Wages: Scheduled regular wages accelerated from an initial base growth rate of over 2% early in the period to a 3% annualized pace by the end of the fiscal year.
- Special Compensation: Year-end corporate bonus allocations held up well, reflecting strong corporate balance sheets from the previous quarters.
- Real Wages: Real wages followed a distinct two-stage path. Through the first half of the review period, high headline inflation squeezed real purchasing power, leaving real labor compensation flat at 0% year-over-year. However, during the final months of the fiscal year, real wages rebounded to a positive annual growth rate of 1% to 2%. This positive turn was driven by a sharp drop in headline consumer price inflation following extended government energy cost subsidies.
2.3 Consumption Expenditures and Market Segmentation
Private consumer spending showed solid underlying resilience despite facing crosscurrents from persistent cost-of-living adjustments. Household purchasing patterns diverged noticeably across product categories:
- Durable Goods: Spending on durable household items, which had expanded on strong consumer demand for electronic appliances, cooled slightly late in the period.
- Non-Durable Goods: Nondurable goods consumption, particularly daily food products, faced ongoing headwinds from persistent consumer cost-consciousness. Households adapted by shifting down to white-label alternatives and smaller packaging units. However, as retail food price inflation slowed late in the period, the drop in nondurable goods consumption bottomed out.
- Services Consumption: Consumer demand for discretionary services, including domestic leisure, regional transit, and specialized personal care, recorded steady growth, serving as the main anchor for overall private demand.
2.4 Consumer Sentiment and Business Survey Inversion
Consumer sentiment indexes followed a volatile path that highlights the sensitivity of the domestic consumer base to headline energy price updates. Consumer attitude metrics had shown steady, broad improvement through the winter months, supported by slowing grocery inflation and the stabilizing effect of government utilities subsidies.
However, this recovery inverted late in the fiscal year. Consumer confidence indices and the household-linked Economy Watchers Survey dipped sharply at the end of the period. This sudden drop was triggered by escalating Middle East tensions, which fueled immediate anxieties over rising regional pump prices for gasoline and potential renewed jumps in imported utility costs.
Section 3: Inflationary Dynamics and Land Values
3.1 Consumer Price Index Components and Inflation Transitions
Japan’s headline inflation metrics underwent a structural transition during the fiscal second half, moving through two distinct phases. For the first portion of the review period, the Core Consumer Price Index (which excludes volatile fresh food items) fluctuated between 2.5% and 3.0%. This persistent inflation was driven by ongoing service-sector adjustments as firms passed higher labor costs into final consumer prices, alongside a sharp run-up in institutional food staples, most notably retail rice prices.
However, during the final months of the fiscal year, headline core inflation slowed significantly, dropping below the 2.0% central bank target threshold. This decelerating trend was driven by two temporary factors:
- The reintroduction and expansion of government electricity and gas subsidies, which lowered public utility costs.
- A statistical base effect as the sharp price spikes recorded in the previous year dropped out of the annual calculation.
3.2 Goods vs. Services Price Adjustments
A granular look at the inflation sub-components reveals an economy adjusting to higher baseline costs:
- Commodity Goods: The goods inflation index saw its positive annual margin narrow. While retail rice and processed food costs remained elevated, local petroleum product prices turned negative on an annual basis. This drop occurred despite geopolitical friction in the Middle East, primarily due to the legislative termination of the legacy provisional fuel tax rate.
- General Services: General services inflation hovered steady at an elevated annual plateau. Corporate values showed a clear shift away from historical discounting norms, with firms consistently passing rising human capital costs down into consumer outlays for commercial dining, lodging, and personal tutoring.
- Public Utilities: Public utility rates fell sharply into negative annual territory, reflecting government intervention to insulate households from high global fuel costs.
3.3 Inflation Expectations and Forecast Models
Despite the drop in headline price indexes at the end of the year, measures of long-term inflation expectations remained firmly anchored on a gradual upward path.
Central bank metrics—including corporate outlooks in the Tankan, consumer sentiment questionnaires, and professional forecaster surveys—showed that medium-term inflation expectations are stabilizing around the 2% inflation target. Financial market indicators, such as the Break-Even Inflation (BEI) rate on inflation-linked sovereign bonds, suggested that market participants increasingly view 2% inflation as a permanent feature of Japan's economic landscape.
3.4 Official Land Valuation Metrics
Reflecting the broader economic recovery and prolonged periods of negative real funding rates, commercial and residential land values registered steady growth. According to official land registry assessments as of January 1, the national average for commercial property land values expanded its positive growth margin. National residential land prices tracked flat at a healthy positive growth rate.
Property markets in the three major metropolitan areas (Tokyo, Osaka, and Nagoya) recorded pronounced appreciation. Land values for both high-density urban commercial cores and suburban residential zones grew at an accelerated annual pace, driven by strong demand for premium office space, urban residential redevelopment, and inflows of foreign real estate capital.
Section 4: International Financial Markets and Global Economy
4.1 Global Growth Trajectories and Market Disruptions
The global macroeconomic environment maintained a pattern of gradual expansion during the review period, though performance diverged across key economic zones amid shifting regulatory and geopolitical conditions. International asset markets experienced a sharp two-stage sentiment shift. Through February 2026, global investor risk sentiment improved steadily, supported by resilient macroeconomic data and an apparent reduction in near-term global policy uncertainty.
However, this stable environment shifted abruptly in March 2026. Investor risk sentiment turned deeply cautious as military and political escalations in the Middle East disrupted traditional shipping routes. This geopolitical shock led to a sharp increase in global market volatility, a flight to safe-haven assets, and renewed concerns over global commodity-driven stagflation.
4.2 Economic Trends Across Major Regions
- United States: The U.S. economy maintained a resilient underlying growth path, supported by robust consumer spending and significant corporate investment in AI infrastructure, despite experiencing localized soft patches. Inflation metrics remained sticky, with both headline and core consumer price indices holding above the Federal Reserve’s 2% target. In response, the Federal Open Market Committee (FOMC) adjusted its monetary policy stance. The Fed implemented consecutive 25-basis-point cuts to its benchmark interest rate during its October and December sessions, lowering the federal funds target range to 3.50%–3.75%. Additionally, after halting its quantitative tightening (QT) balance sheet drawdowns on December 1, the Fed announced plans to purchase shorter-duration Treasury securities to maintain a comfortable floor of banking reserves.
- Euro Area: The euro area economy exhibited a modest recovery, anchored primarily by durable domestic consumption, though it faced ongoing weakness in external industrial demand. Core inflation indicators trended sticky above the 2.0% threshold, while headline price indexes spiked late in the period due to the Middle East oil shock. Given these crosscurrents, the European Central Bank (ECB) adopted a cautious approach, holding its main deposit facility rate steady at 2.00%. ECB leadership maintained a strictly data-dependent stance, emphasizing that future policy adjustments would be determined on a meeting-by-meeting basis.
- China: The Chinese economy followed a volatile growth path. Activity slowed through the winter months due to tariff barriers on its export goods and a fading of earlier domestic stimulus measures. However, the industrial sector staged a partial recovery late in the period, lifted by an increase in export volumes to alternative non-aligned consumer markets. Consumer price metrics trended soft, tracking below the government’s annual 2% target. In response, Beijing deployed an array of fiscal and monetary support measures. At the March National People's Congress, policymakers approved sustained high-volume fiscal deficit spending. Concurrently, the People’s Bank of China lowered reserve requirement ratios (RRR) and adjusted benchmark lending rates to provide ample liquidity support for the domestic banking system.
- Emerging Market Economies: Non-aligned emerging economies in Asia and Latin America maintained a gradual recovery path, supported by strong global demand for technology inputs and industrial metals. With domestic inflation largely contained within institutional boundaries, several regional central banks utilized the opportunity to implement interest rate cuts to lower local financing costs.
4.3 International Commodities and Sovereign Bond Yields
Global commodity and fixed-income markets experienced significant volatility, driven by shifting supply dynamics and escalating geopolitical tensions:
- Energy and Industrial Metals: WTI crude prices initially trended soft due to rising production volumes from non-OPEC non-aligned producers, but spiked sharply higher in March 2026 on supply and transit disruptions in the Middle East. Copper values posted substantial gains on the London Metal Exchange (LME), driven by supply constraints in major mining regions and expanding structural demand from global data centers.
- Precious Metals and Agriculture: Financial safe-haven flows and structural asset diversification by emerging market central banks propelled international gold prices to historic highs before high global funding rates capped late-stage gains. Agricultural commodity prices recorded steady, volatile increases across the review period.
- Sovereign Bond Markets: Long-term government bond yields across advanced economies shifted higher. In the United States and continental Europe, 10-year sovereign bond yields faced upward pressure as investors adjusted to sticky core inflation data and priced in the potential inflationary impact of high global oil values.
Section 5: Domestic Financial Markets and Credit Operations
5.1 Short-Term Money Markets and Policy Target Execution
The operational environment of Japan's domestic interbank money market adjusted smoothly to the updated policy target frameworks implemented by the Bank of Japan. In the uncollateralized overnight call market, the key benchmark rate tracked in close alignment with the central bank’s target bands.
Prior to the December Policy Board session, the uncollateralized overnight call rate gravitated around 0.5%. Following the policy shift approved at that meeting, the overnight rate adjusted cleanly to its new operational target of approximately 0.75%, where it remained for the rest of the fiscal year. In the short-term term-debt space, 3-month Tokyo Overnight Average Rate (TONA) Overnight Index Swap (OIS) yields trended steadily upward, reflecting market adjustments to a higher policy rate. Yields on 3-month Treasury Discount Bills (TDBs) rose in tandem, moving higher within a volatile trading range.
5.2 Sovereign Debt Dynamics and Yield Curve Shifts
Japanese sovereign bond yields shifted notably higher across the maturity spectrum, driven by evolving inflation expectations and international market developments:
- 10-Year JGBs: The benchmark 10-year Japanese Government Bond (JGB) yield experienced an initial sharp run-up through mid-January 2026, driven by rising market expectations of a near-term policy target adjustment. Yields then pulled back through late February as institutional investors covered short positions and bought back sovereign debt. However, this rally inverted in March, with yields climbing again as rising global oil prices re-ignited domestic inflation anxieties.
- Super-Long Tenors: Yields on 20-year and 30-year JGB tenors tracked a broadly similar path, with yield spreads steepening significantly late in the period due to changing investor demand and a reduction in long-term central bank asset purchases.
- Short-to-Medium Maturities: Short-duration 2-year JGB yields drifted steadily upward throughout the period, pricing in the central bank's shift away from its historical ultra-low interest rate framework.
5.3 Corporate Debt Issuance and Credit Spreads
Yields on primary corporate debt moved higher over the fiscal second half, tracing the broader upward shift in the underlying sovereign yield curve. Primary credit spreads for top-tier investment-grade corporate bonds (rated AA and A) remained tightly anchored, reflecting solid investor confidence in corporate balance sheets.
Spreads for BBB-rated corporate names widened slightly but stayed well within historical norms, as deep domestic liquidity pools and strong institutional appetite for corporate yield supported the primary market. Total outstanding corporate bonds and commercial paper posted steady annual growth, supported by large-scale pre-funding operations by major blue-chip enterprises ahead of anticipated increases in long-term borrowing costs.
5.4 Domestic Equity Performance and Valuation Inversion
Japan’s equity markets delivered strong net performance over the full review period, though the market experienced a sharp valuation inversion during the final month. The Nikkei 225 Stock Average staged a powerful rally through February 2026, driven by high corporate earnings, steady inflation pass-through, and strong investor support for corporate governance updates. The index reached historic highs, testing the 51,000-yen threshold by late winter.
However, this upward momentum reversed in March 2026. Escalating Middle East geopolitical tensions triggered a sharp pull-back as international investors trimmed risk assets and cut leverage. Despite this late retracement, the Nikkei 225 closed out the fiscal year with significant net annual gains, anchoring its long-term structural recovery.
5.5 Foreign Exchange Adjustments and Real Effective Exchange Rates
In foreign exchange markets, the Japanese yen experienced persistent downward pressure against major currencies, continuing its broader deprecation trend. The yen's exchange rate against the U.S. dollar trended steadily lower, closing the fiscal year around the 159-yen mark. This depreciation was driven by persistent wide interest rate differentials between Japan and other advanced economies, which overshadowed the BOJ’s December rate hike.
The yen followed a similar downward path against the euro. Consequently, both the Nominal Effective Exchange Rate and the inflation-adjusted Real Effective Exchange Rate for the yen hit historic lows, enhancing price competitiveness for Japan’s export sectors but increasing the domestic cost of imported food and energy inputs.
Section 6: Corporate Finance and Banking Inflow Metrics
6.1 Enterprise Financing Demands and Total Bank Lending
Enterprise credit conditions remained highly supportive of business activity, even as market financing costs shifted higher. Aggregate corporate credit demand rose steadily, driven by a range of funding needs:
- Sustained funding requirements for executing cross-border mergers and corporate acquisitions.
- Working capital outlays needed to manage higher costs for raw material inputs.
- Expanding fixed-capital credit requirements for structural automation projects.
To meet this demand, aggregate bank lending volumes from domestic commercial banks grew at a steady annual pace of 4.5% to 5.2%. Total financing across the corporate sector was further supported by a 7.0% to 7.5% annual increase in outstanding corporate bonds and commercial paper.
6.2 Credit Standards and Institutional Financing Conditions
According to senior loan officer surveys and enterprise assessments, financial institutions maintained highly accommodative lending standards. The Tankan Lending Attitude DI indicated that commercial banks remained highly willing to extend credit to both large corporations and small-to-medium enterprises (SMEs).
Enterprise liquidity conditions remained healthy overall, with corporate insolvency metrics tracking flat within a stable range. While localized failures edged higher among marginal small firms facing acute labor shortages or struggling to pass on rising material costs, these cases remained contained and did not pose systemic risks to the broader credit system.
6.3 Liquidity Metrics and Aggregate Financial Flows
- Monetary Base: The headline Monetary Base (defined as the sum of circulating currency plus commercial bank reserves held at the central bank) recorded a widening contraction during the review period. This downward trend was the direct result of policy choices, reflecting a systematic reduction in long-term sovereign bond purchases and a scheduled wind-down of legacy crisis-era institutional credit facilities.
- Money Stock: In contrast, the M2 money supply aggregate maintained steady annual growth of 1.5% to 2.0%, supported by ongoing commercial credit expansion and a continuous net inflow of corporate deposits into the domestic banking system.
Section 7: Monetary Policy Operations and Policy Board Governance
7.1 Policy Board Deliberations and Structural Governance
The Policy Board of the Bank of Japan held four regularly scheduled monetary policy meetings during the six-month review period under the chairmanship of Governor Kazuo Ueda. Board attendance was consistent across sessions, with Deputy Governors Shinichi Uchida and Ryozo Himino participating alongside the six independent 審議委員 (Deliberative Members).
The report notes that during the winter sessions, Deputy Governor Uchida participated remotely via secure telephone conference links from his main office suite. High-ranking representatives from the Ministry of Finance and the Cabinet Office attended all policy sessions as non-voting observers, providing regular updates on government fiscal priorities and macro-stabilization initiatives.
7.2 granular Analysis of Policy Votes and Institutional Dissent
The Policy Board's voting patterns reveal a shifting consensus as policymakers navigated the transition away from historic monetary stimulus:
October 2025 Session
The Board voted 7-to-2 to maintain its baseline overnight lending target at 0.5%. Deliberative Members Tsutomu Takata and Naoki Tamura entered formal votes of dissent against the majority decision.
- Member Takata argued that Japan’s structural inflation norm had fundamentally shifted, meaning the statutory 2% inflation target had been sustainably achieved and justifying an immediate move to 0.75%.
- Member Tamura focused on risk management, contending that the central bank needed to raise policy rates immediately toward estimated neutral levels to avoid the risk of sharp inflationary spikes later.
December 2025 Session
The Policy Board reached a unanimous 9-to-0 decision to implement a 25-basis-point rate hike, lifting the uncollateralized overnight call rate target to 0.75%. This collective agreement reflected an assessment that the structural momentum of wage increases and service-sector price adjustments had become sufficiently secure to warrant an adjustment to the degree of monetary accommodation.
January and March 2026 Sessions
The Board voted 8-to-1 to hold the policy target rate steady at 0.75%. Deliberative Member Takata dissented at both meetings, arguing that core inflation trends remained sticky and global demand solid, which justified an immediate further increase in the policy rate to 1.0% to prevent the bank from falling behind the inflation curve.
Section 8: Balance Sheet Analysis and Operational Implementation
8.1 Aggregate Assets and Financial Inflow Adjustments
As of March 31, 2026, the aggregate balance sheet of the Bank of Japan recorded a total asset valuation of 663.0 trillion yen, representing a net annual contraction of 9.1%. This contraction reflects a deliberate policy shift toward normalizing the central bank’s operational footprint:
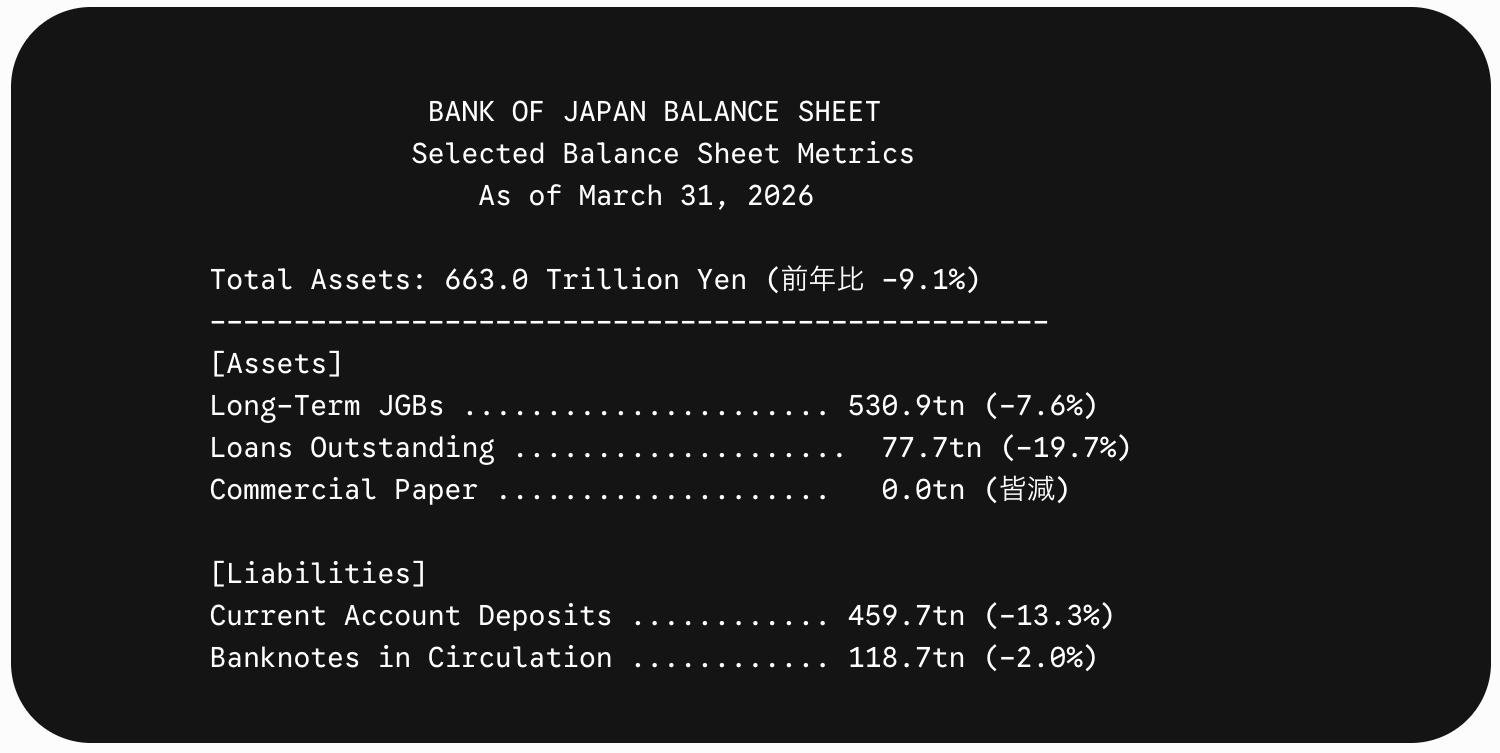
- Long-Term Government Debt: Total holdings of long-term Japanese Government Bonds fell to 530.9 trillion yen, an annual decline of 7.6%. This drop was driven by the systematic implementation of the bond-purchase reduction plan adopted at the June 2025 meeting, under which monthly JGB purchases were stepped down from 3.7 trillion yen to 2.9 trillion yen.
- Short-Term Government Debt: Holdings of short-duration Treasury Discount Bills were completely wound down, dropping to zero by the close of the fiscal year.
- Loans Outstanding: The central bank's loan portfolio decreased by 19.7% annually to 77.7 trillion yen. This decline was driven by steady net repayments as commercial banks retired funding under legacy lending programs, most notably the Loan Support Program.
8.2 Granular Risk Allocations and Non-Sovereign Assets
The central bank maintained a conservative approach toward its risk asset portfolios, keeping holdings steady across major non-sovereign categories:
- Commercial Paper: Holdings of commercial paper were fully phased out, hitting zero at the end of the year.
- Corporate Bonds: The outstanding portfolio of corporate bonds declined by 54.8% to 2.2 trillion yen, as maturing corporate debt was allowed to run off without replacement.
- Exchange-Traded Funds (ETFs): The book value of the central bank's ETF portfolio held stable at 37.1 trillion yen, with operations limited to passive dividend reinvestments.
- Japan Real Estate Investment Trusts (J-REITs): The central bank's J-REIT portfolio held flat at a book value of 700 billion yen.
8.3 Operational Flow Frameworks and Specialized Facilities
The bank adjusted its liquidity operations to align with its policy normalization goals, shifting funding away from emergency facilities and toward targeted development programs:
- Climate Change Operations: The Climate Change Response Facility saw its outstanding balance rise to 21.1 trillion yen, as commercial banks actively utilized this specialized central bank window to fund qualifying green investment projects.
- Disaster Relief Windows: The operational window supporting financial institutions in natural disaster zones maintained an active baseline of 13.0 billion yen.
- Lending Support Facilities: Funding outstanding under the Loan Support Program fell to 48.5 trillion yen, as commercial banks continued to clear out legacy borrowing lines.
- Unified Collateral Frameworks: Operational balances under standard pooled collateral operations held steady at 7.8 trillion yen throughout the period.
Section 9: Outlook, Risks, and Monetary Strategy
9.1 Underlying Wage-Price Virtuous Circle Tractions
In its detailed outlook assessments, the Bank of Japan expressed confidence that the structural baseline of the domestic economy has broken away from historical trends. Policy Board models indicate that the virtuous circle linking wage increases to service-sector price adjustments has achieved self-sustaining traction.
Central bank analysts noted that even when temporary factors—such as government utility subsidies—pull headline inflation indexes below the 2.0% target, underlying core-core inflation measures (which exclude both fresh food and energy costs) are stabilizing around 2%. This trend is supported by steady service-sector price adjustments and a persistent positive output gap across the domestic economy.
9.2 The "Two-Pillar" Policy Review Framework
The Policy Board evaluated its monetary strategy through its established "Two-Pillar" assessment framework to ensure policy alignment with long-term macroeconomic stability:
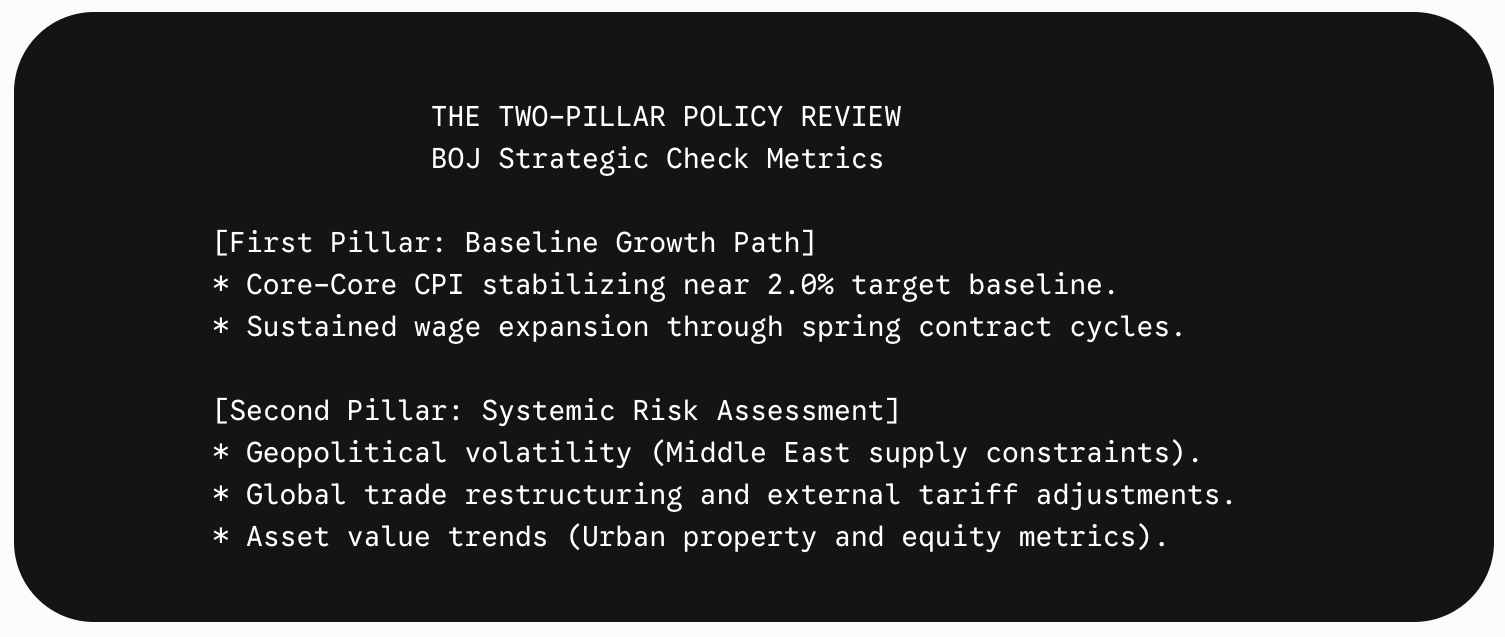
- First Pillar (Baseline Outlook): The first pillar covers the structural baseline for growth and inflation. The baseline model projects that the domestic economy will maintain a steady expansion pace slightly above its potential growth rate. This expansion is expected to be driven by robust corporate investment in automation and steady, positive real wage growth that supports household consumption.
- Second Pillar (Risk Management): The second pillar focuses on assessing systemic risks to the baseline outlook. While the Policy Board concluded that domestic financial conditions show no signs of systemic overheating or asset market bubbles, it identified several significant external risks that require close monitoring.
9.3 Detailed Risk Profiles and Global Policy Headwinds
The central bank's report outlines several key risks that could affect the projected economic path:
- Middle East Supply Disruptions: Long-term military and political instability in the Middle East represents a notable risk. If shipping lane disruptions or infrastructure damage lead to a prolonged oil shock, the resulting stagflationary pressures could slow global economic activity while driving up domestic energy costs for Japanese households.
- Global Trade Friction: The potential for further escalations in international tariff barriers remains a source of uncertainty. Persistent trade tensions could dampen global trade volumes, complicate corporate planning for international supply chains, and weigh on export revenues for major Japanese industrial groups.
- Imported Input Cost Volatility: Fluctuations in global raw material values and foreign exchange shifts create dual risks. Further depreciation of the yen could push up the cost of imported food and fuel inputs, potentially squeezing household budgets and dampening real consumer spending.
9.4 Strategic Direction for Interest Rates and Market Guidance
Looking ahead, the Bank of Japan confirmed that its primary strategy is to gradually reduce monetary accommodation as economic conditions improve. Central bank guidance indicates that given deeply negative real interest rates, additional target rate hikes will be appropriate as long as growth and inflation perform in line with baseline forecasts.
However, Policy Board members emphasized that they are not following a predetermined or mechanical normalization path. The central bank intends to maintain a flexible, data-dependent approach, evaluating incoming economic indicators at each Policy Board session to carefully balance the goal of long-term price stability with the need to support domestic growth.