The FSA's Second Fund Monitoring Survey


The Financial Services Agency (FSA) conducts the Fund Monitoring Survey in light of requests from the International Organization of Securities Commissions (IOSCO) and others for national authorities to collect data on funds of a certain scale from the perspective of financial stability, as well as for the Agency's own monitoring purposes. The FSA has now compiled the summary of results for the second survey and published them.
The analysis illuminates the market's composition, growth dynamics, and key risk profiles as of December 2024, offering critical insights for financial analysts and investment managers. A key theme emerging from the data is the stark strategic divergence between the retail-oriented public market and the institutionally-driven private market.
The survey's methodology, as established by the FSA, is grounded in a systematic approach to data collection for financial stability monitoring:
- Objective: To gather data on funds with a net asset value of JPY 50 billion or more, supporting financial stability monitoring efforts in line with recommendations from the International Organization of Securities Commissions (IOSCO).
- Scope: Covers domestically registered Japanese funds, including Investment Trusts, Investment Corporations, Collective Investment Schemes, and Investment Discretionary Agreements employing a "Hedge Fund Strategy" (though no funds were reported under this last category in the survey period).
- Data Points: The survey collected information on asset composition, liquidity risk factors, derivative usage, and borrowing.
- Reporting Period: The data reflects the state of the market at the end of December 2024.
This analysis begins with a high-level view of the market's aggregate scale before dissecting its structural and strategic components and concluding with an assessment of its risk characteristics.
1. Aggregate Market Size and Growth Dynamics
Understanding the market's overall scale and growth trajectory is essential for assessing the health and momentum of Japan's asset management sector. These top-line figures indicate a period of significant expansion. This substantial growth points to a confluence of robust market performance and strong capital inflows into the Japanese fund ecosystem.
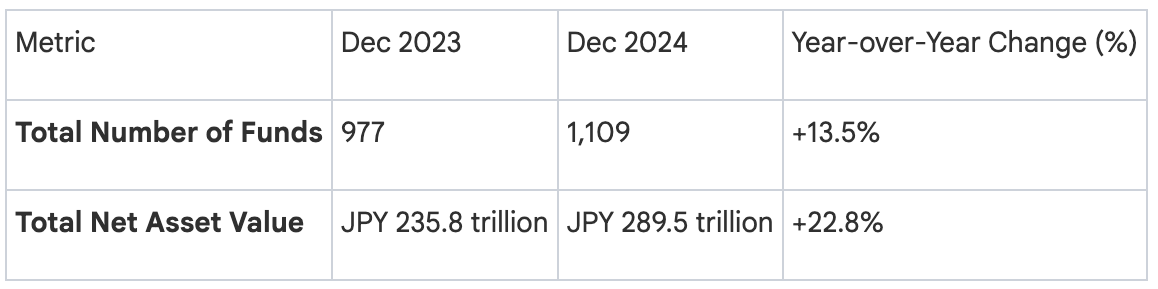
The analysis of these figures reveals significant double-digit growth in both the number of large funds and their total net assets. The surveyed Investment Trusts' net assets of JPY 271.4 trillion represent approximately 77.7% of the entire domestic investment trust market (excluding Money Reserve Funds). This high concentration confirms that the surveyed funds are not merely a sample but represent the systemically-important core of the Japanese domestic market.
The survey encompassed 150 management companies. The breakdown by primary business type is as follows:
- Investment Trust Management Companies: 69
- Investment Corporation Asset Managers: 60
- Self-Managed Investment Corporations: 2
- Qualified Institutional Investor Special Business Filers: 19
Having established the overall market expansion, the following section will examine the composition of this growth across different fund structures and investment strategies.
2. Fund Composition: Structural and Strategic Analysis
A deeper understanding of the market requires analyzing its composition by both legal structure and investment strategy. This dual perspective reveals where capital is concentrated and how investment approaches differ across the public and private segments of the market.
2.1 Analysis by Fund Structure
The Japanese fund market is dominated by Investment Trusts, particularly those available to the public, whose market share has continued to expand over the past year and solidify their central role in the landscape.
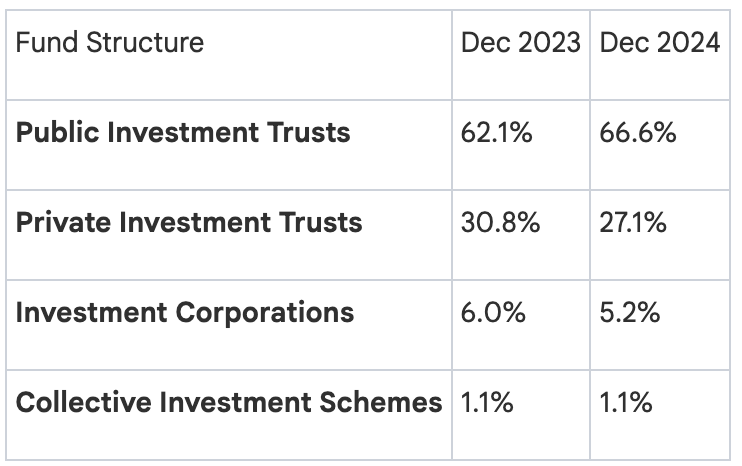
These findings reveal the growing dominance of Public Investment Trusts, which increased their market share by 4.5 percentage points to account for two-thirds of surveyed assets. A major component of this category is Exchange-Traded Funds (ETFs), which alone represent precisely 30.0% of the total surveyed net asset value, underscoring the increasing importance of passive vehicles in the Japanese market. All surveyed Investment Corporations are focused on real estate investment.
2.2 Analysis by Investment Strategy (Fund Type)
Alongside structural shifts, the market has undergone a significant strategic rotation in asset allocation. These findings indicate a clear and pronounced move towards equity-focused strategies, largely at the expense of fixed-income allocations.
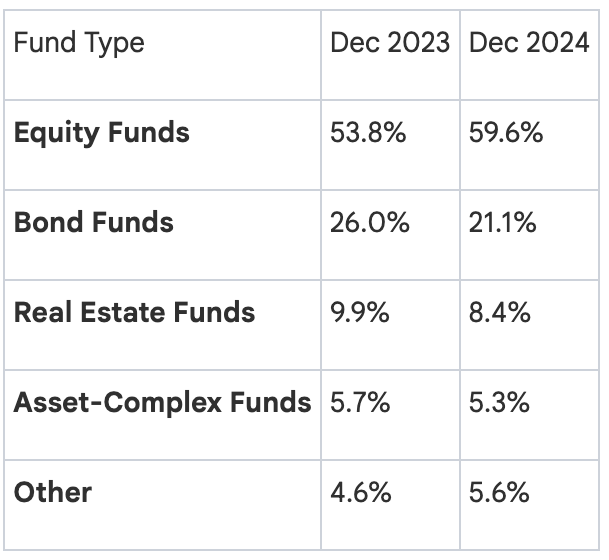
The strategic shift towards equities is the most prominent trend, with the market share of Equity Funds growing by nearly six percentage points to almost 60% of the total. Conversely, Bond Funds saw their share decline by nearly five percentage points. This pronounced rotation likely reflects a broader risk-on sentiment in the market, with investors seeking higher returns from corporate earnings growth in a persistently low-yield environment for fixed income.
Synthesizing the data on fund structure and strategy reveals a distinct segmentation. Different fund structures cater to markedly different investment objectives:
- Public Investment Trusts: This segment is overwhelmingly dominated by Equity Funds, which comprise 83.6% of the assets within this structure.
- Private Investment Trusts: In stark contrast, these funds are primarily focused on fixed income, with Bond Funds accounting for 63.4% of assets.
- Investment Corporations & Collective Investment Schemes: These structures are almost exclusively dedicated to alternative assets, predominantly Real Estate, which accounts for 100% and 65.8% of their respective assets.
This clear strategic divergence between the public retail market and the private institutional market leads to an analysis of the primary investors in these private vehicles.
3. Investor Profile of Private Market Funds
Analyzing the investor base for private funds—which include Private Investment Trusts, Private Investment Corporations, and Collective Investment Schemes—is crucial for understanding the primary sources of institutional capital and the demand drivers in the non-public market. The data reveals that domestic financial institutions are by far the most significant allocators to these vehicles.
Based on net asset value, the aggregate investor profile for all surveyed private funds is dominated by a few key institutional categories:
- Domestic Financial Institutions: 53.7%
- Funds (e.g., Funds-of-Funds): 5.9%
- Business Corporations: 2.6%
- Private Pensions: 1.7%
While domestic financial institutions are the largest investors overall, the investor profile varies significantly across different private fund types. For Private Investment Trusts, financial institutions are the primary backers (54.7%). However, Business Corporations are the largest investor group in Collective Investment Schemes (57.1%), while Private Pensions hold a significant stake in Private Investment Corporations (19.4%). This highlights the specialized roles these different fund structures play for various institutional investors.
This understanding of who invests in private funds provides context for the subsequent analysis of what these funds invest in.
4. Portfolio Exposure and Asset Allocation
To understand the market's true risk appetite and exposure, we must look through the fund structures to the underlying assets. This section dissects the portfolio composition to reveal where capital is actually being deployed and the primary instruments used for risk mitigation.
The largest direct portfolio exposures (excluding derivatives) are heavily concentrated in equities. The primary asset classes are:
- Listed Equities: JPY 163.3 trillion
- Bonds (Corporate, National, and Local combined): JPY 49.6 trillion
- Collective Investment Schemes (often Funds-of-Funds): JPY 44.2 trillion
The exposure to Listed Equities saw a substantial year-over-year increase of 34.0%, reinforcing the strategic shift identified in the previous section.
Derivatives are used extensively across the market, primarily for hedging purposes rather than speculative leverage. The data indicates a focus on managing risks associated with international investments.
- Dominant Types: Foreign Exchange (FX) derivatives (55.0% of total) and Interest Rate derivatives (35.1%) make up the vast majority of derivative usage. This is consistent with widespread hedging of currency and interest rate risks inherent in foreign equity and bond portfolios.
- Counterparties: The choice of counterparty varies by derivative type. FX derivative trading is concentrated with banks (81.0%), while "Other" derivatives (e.g., equity, credit) are primarily traded with other financial institutions like securities firms (90.6%).
The nature of these portfolio holdings and the extensive use of hedging derivatives directly inform the market's overall risk profile.
5. Risk Profile Assessment
A core objective of the FSA's monitoring survey is to identify and assess potential sources of systemic risk within the fund industry. This section evaluates the key risk dimensions highlighted in the report: liquidity, leverage, and counterparty exposure.
5.1 Liquidity Risk
The FSA's report assesses liquidity risk by comparing the time required to liquidate a fund's portfolio ("portfolio liquidation days") against the time promised to investors for processing withdrawals ("investor redemption days"). For the surveyed funds overall, portfolio liquidity appears sufficient to meet redemption requests under normal market conditions, with liquidation timelines generally matching or being shorter than redemption periods.
For instance, in the case of Investment Trusts, approximately 90% of net assets can be liquidated within 7 days. This timeline closely aligns with the redemption terms offered to investors, where about 80% of assets are available for redemption within the same 7-day window.
However, the FSA provides several crucial caveats to this aggregate picture:
- The data represents a market-wide average and does not reflect the liquidity profile of any individual fund.
- The analysis is based on an assumption of normal market conditions and does not model behavior during periods of significant market stress.
- Some liquidity mismatches exist, particularly in Investment Corporations and Collective Investment Schemes, though these are typically managed through contractual tools like redemption restrictions.
5.2 Leverage Analysis
The survey measures two distinct types of leverage, which are applied differently across the market.
First, Gross Leverage measures a fund's total market exposure relative to its net assets. For Investment Trusts, its use is limited. After adjusting for derivatives used for hedging, the average Gross Leverage is a conservative 1.03x, indicating that these funds are generally not employing leverage to amplify returns. In contrast, Investment Corporations exhibit a much higher average Gross Leverage of 2.06x. This elevated leverage is not speculative but rather structural, directly corresponding to the real estate-centric strategy identified previously, where debt financing is a fundamental component of the investment model.
Second, Financial Leverage measures direct borrowing relative to net assets. This form of leverage is almost non-existent in Investment Trusts due to regulatory restrictions. Conversely, it is a primary funding tool for Investment Corporations (0.85x average) and certain Collective Investment Schemes (0.47x average), which use cash borrowings to acquire assets. The primary source for this financing is overwhelmingly banks, which provide 87.2% of the borrowed capital.
5.3 Counterparty Risk
The survey tracks counterparty risk arising from derivative transactions. A significant trend is evident in the Investment Trust sector, where settlement via a Central Counterparty (CCP) has risen to 53.7%, now surpassing bilateral Over-the-Counter (OTC) settlement. This structural shift is critical as it substantially mitigates the risk of a single counterparty default impacting the fund.
This de-risking trend, however, has not extended to other fund types. Both Investment Corporations and Collective Investment Schemes remain 100% reliant on OTC settlement for their derivative transactions.
When quantifying the remaining counterparty exposure, the risk for most fund types is low (below 1.5% of net assets). However, there is a key area of concentration: Private Investment Trusts report a significant concentration of bilateral counterparty risk from their OTC derivative positions, equivalent to 14.0% of their total net asset value. This figure stands in stark contrast to the de-risking seen in the public markets and pinpoints the Private Investment Trust sector as a key pocket of systemic risk that warrants close regulatory and investor scrutiny.
6. Conclusion
The Japanese investment fund landscape in 2024 is a tale of two markets: a booming, equity-driven public sector and a highly specialized, institutionally-dominated private sector where specific, concentrated risks are building. The key takeaways from this analysis are as follows:
- Strong Market Growth: The Japanese fund market demonstrated robust growth in 2024, with a 22.8% increase in net assets for large funds, driven primarily by Public Investment Trusts.
- Strategic Shift to Equities: A clear market-wide rotation into equities is underway, with equity funds now comprising nearly 60% of assets, largely at the expense of bond funds, reflecting a broader risk-on sentiment.
- Divergent Segment Strategies: The market is distinctly segmented, with the public market focused on equities and the private market dominated by bond and real estate strategies funded by institutional capital.
- Contained but Concentrated Risks: While overall risk profiles appear managed, key areas for monitoring include liquidity during market stress, leverage inherent in real estate funds, and the significant OTC derivative counterparty risk concentrated within the Private Investment Trust sector.