Japan Exchange Group Reports Q2/FY2025 Results


Japan Exchange Group (JPX) reported solid financial results for the first half of fiscal year 2025 (FY2025 Q2 cumulative), driven primarily by increased activity in cash equities and a significant contribution from interest rate-related collateral management within clearing services.
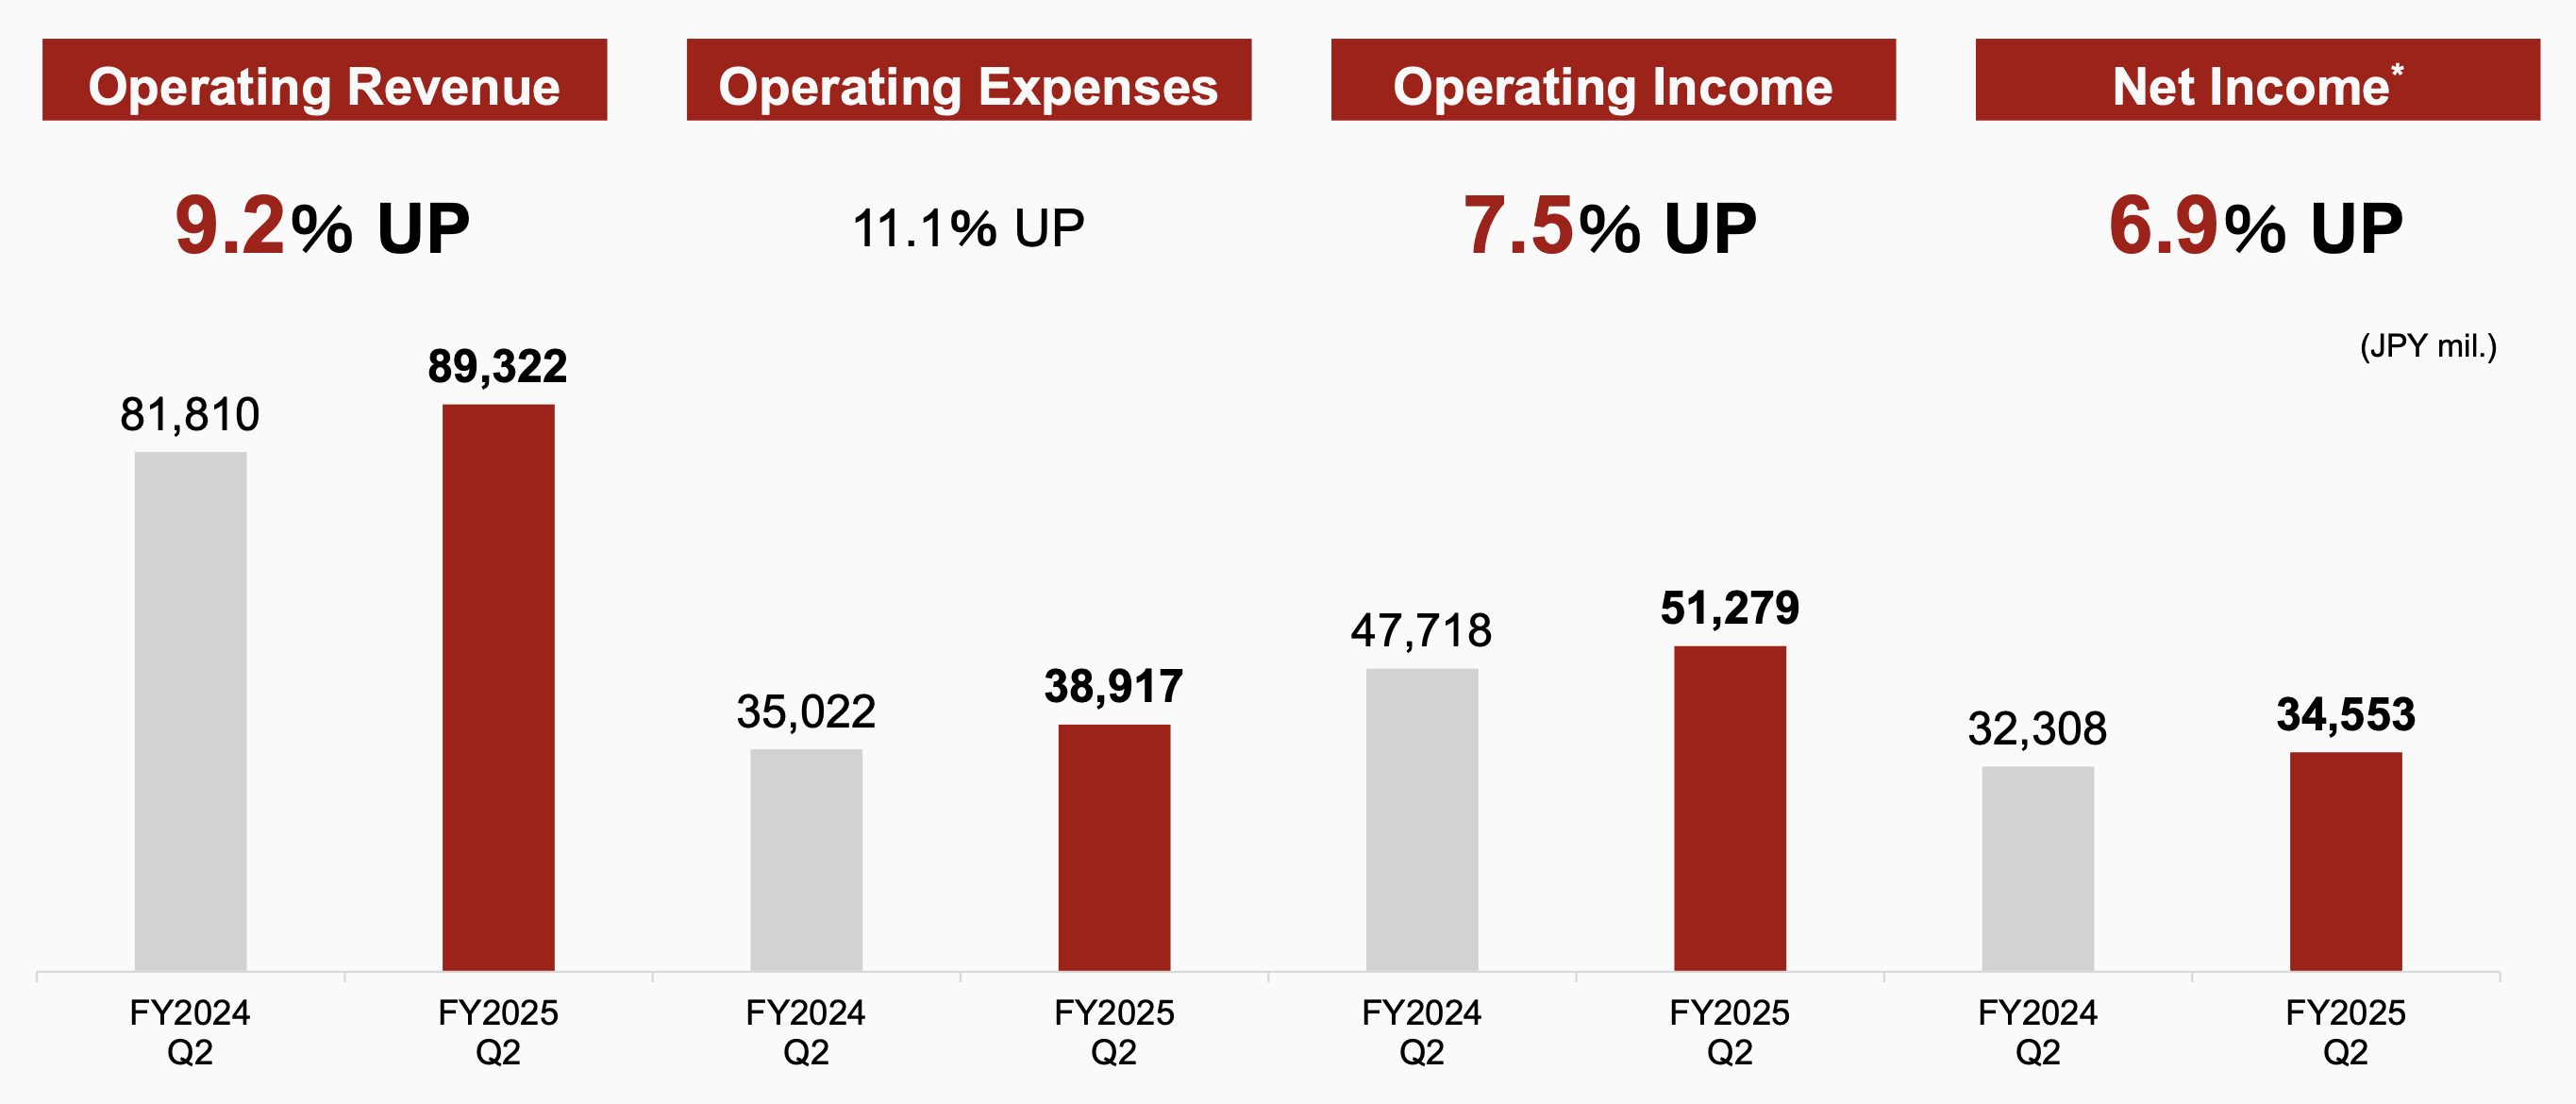
Operating Revenue rose 9.2% year-over-year (YoY) to JPY 89,322 million, and Operating Income grew 7.5% YoY to JPY 51,279 million. Net Income attributable to owners of the parent company increased 6.9% to JPY 34,553 million.
Following the strong results, JPX revised its full-year earnings forecast upward.
Operating Revenue Analysis
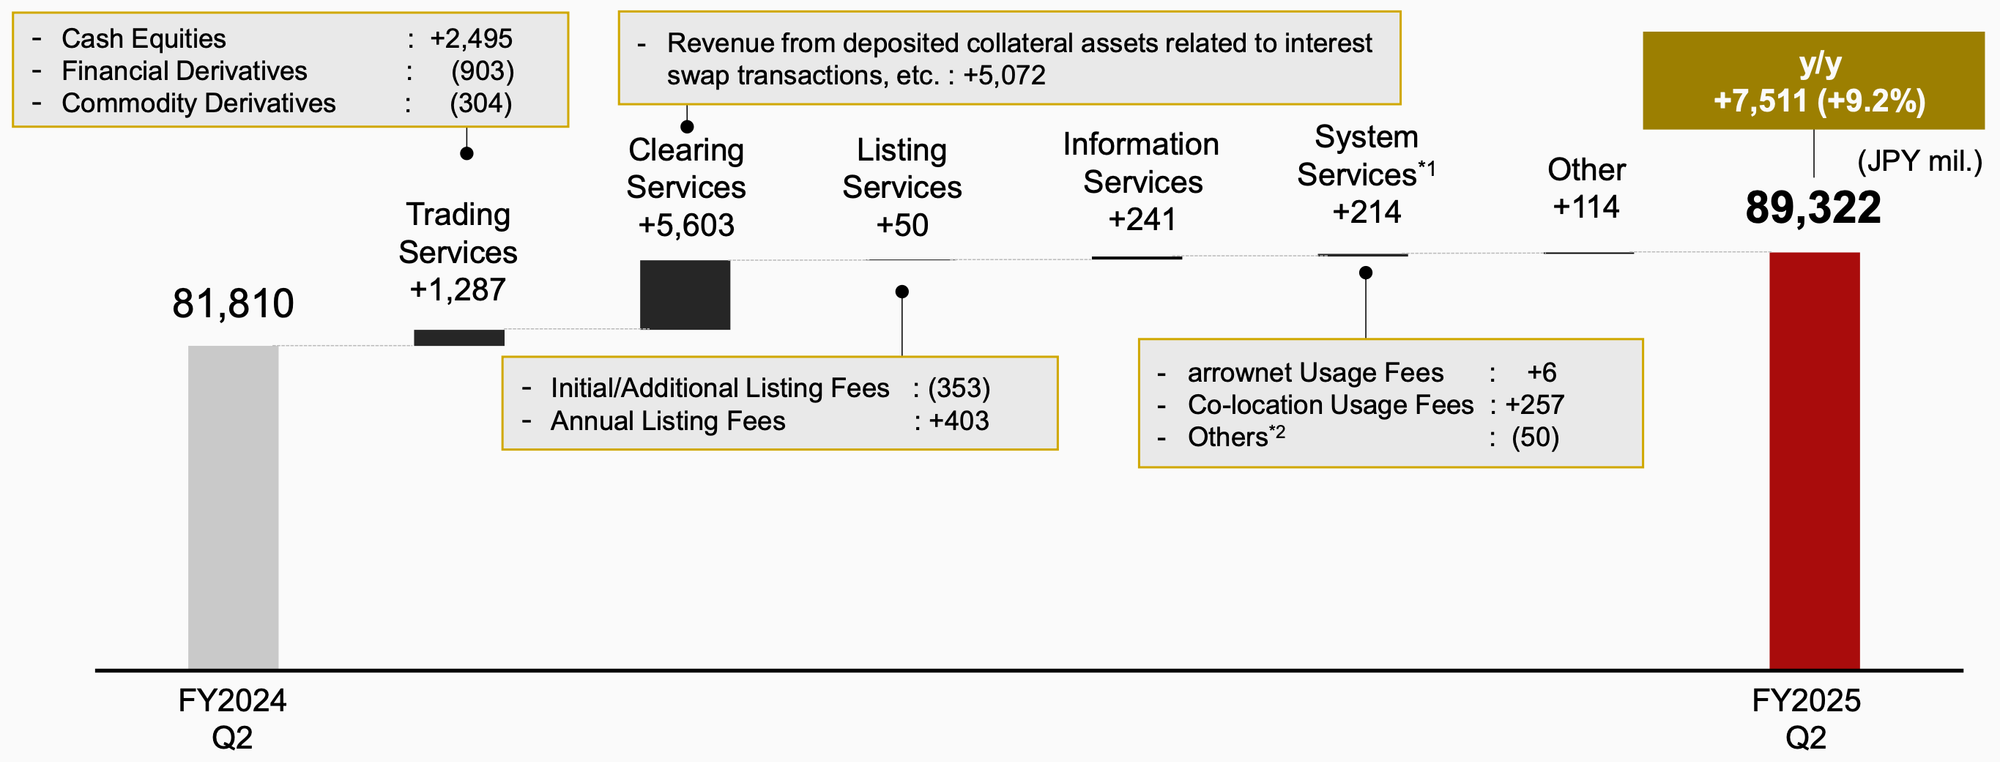
All primary revenue categories showed growth, reflecting a lively Japanese stock market environment.
1. Trading Services Revenue (+3.8% YoY to JPY 34,767 mil.)
While overall trading services revenue increased due to cash equities activity, gains were offset by lower derivatives volumes.
- Cash Equities: Transaction fees for cash equities increased 9.6% YoY, supported by a 9.5% rise in Average Daily Trading Value (ADTV) to JPY 6.28 trillion.
- Financial Derivatives: Transaction fees declined 16.9% YoY (JPY 4,324 mil.) due to a decline in trading volume following a surge in market volatility in April 2025. Major derivative volumes, including TOPIX Futures and Nikkei 225 Futures, saw double-digit contract declines.
- Commodity Derivatives: Transaction fees declined significantly by 34.5% YoY.
2. Clearing Services Revenue (+32.1% YoY to JPY 23,059 mil.)
Clearing Services revenue saw the largest percentage increase, driven by two factors:
- Collateral Management: A substantial contribution of JPY 5,072 million from revenue earned on deposited collateral assets related to interest rate swap transactions.
- Increased Obligations: An increase in average daily obligations assumed for cash equities and interest rate swaps also contributed positively.
3. Listing Services Revenue (+0.6% YoY to JPY 7,902 mil.)
This segment saw modest growth, with Annual Listing Fees increasing 6.4%, offsetting a 22.5% decline in Initial/Additional Listing Fees. Annual Listing Fees benefited from an increase in assets under management, resulting from domestic ETF prices exceeding the previous year’s calculation prices.
4. System Services Revenue (+3.2% YoY to JPY 6,855 mil.)
This growth was mainly attributable to an 8.8% increase in the usage of co-location services.
Operating Expenses Analysis
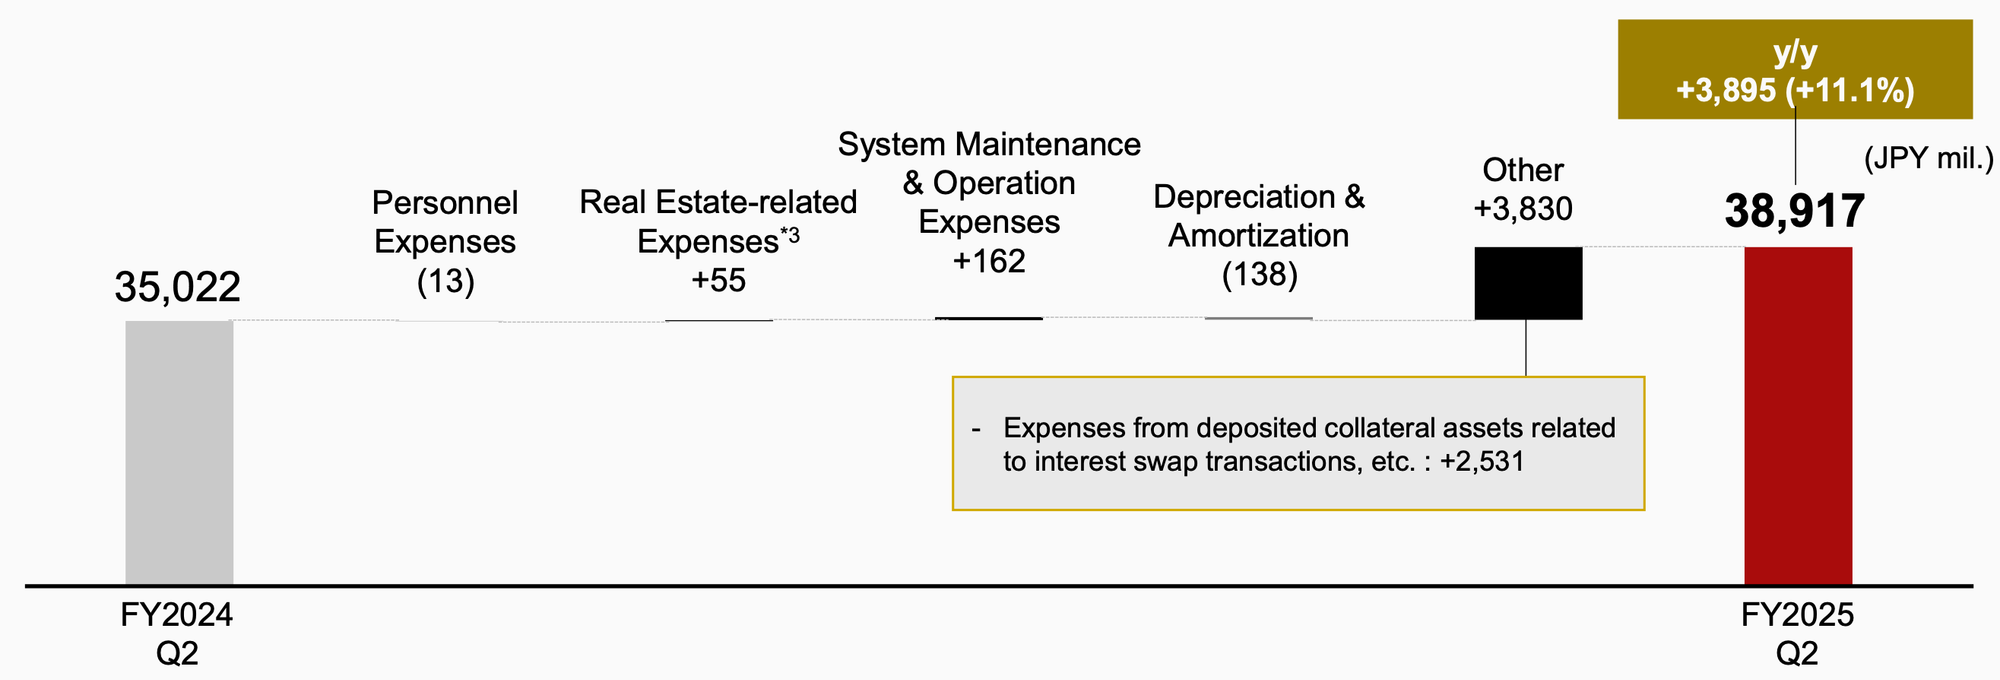
The high growth rate in expenses was primarily driven by one-off items related to clearing activities, mirroring the strong revenue generated from the same source.
- Other Operating Expenses (+96.4% YoY to JPY 7,801 mil.): This category increased sharply, predominantly due to the amount returned to clearing participants for deposited collateral assets related to interest swap transactions (JPY 2,531 million). This expense is the corresponding outflow related to the substantial revenue gain in Clearing Services. The increase was also impacted by a decrease in "software carryover" following the launch of new systems like arrowhead 4.0.
- Personnel Expenses (0.1% YoY to JPY 11,216 mil.): Expenses remained essentially flat.
- System Maintenance & Operation (+1.6% YoY to JPY 10,315 mil.): Expenses saw a modest increase.
Market Trends and Key Drivers
1. Cash Equities Activity
The Average Daily Trading Value (ADTV) for cash equities increased 9.5% YoY to JPY 6.28 trillion. This strength was broad-based across auction markets:
- Prime Market Domestic Stocks ADTV increased 6.9%.
- Standard Market ADTV surged 39.7%.
- Growth Market ADTV jumped 59.7%.
Market observers noted that cash equity turnover velocity remains structurally elevated above its historical mid-cycle average. This persistent momentum is linked to ongoing corporate governance reforms, particularly the accelerated unwinding of cross-shareholdings. This trend has increased the free-float percentage of the market, attracting greater participation from high-velocity investors, such as foreign and individual participants, who contribute significantly to total cash turnover.
2. Derivatives Activity
Trading volume for major derivatives products declined, attributed mainly to reduced market volatility during the period. The total trading volume for Financial Derivatives (converted into large-sized contracts) fell 18.6% YoY to 46 million contracts.
- TOPIX Futures trading volume fell 10.6%.
- Nikkei 225 Futures trading volume fell 27.1%.
- 10-year JGB Futures trading volume fell 17.3%.
Derivatives trading volume continued to show year-over-year weakness, which is largely tied to a moderation in market volatility. Volumes fell across all major participant groups. The effective trading fee rate showed a slight contraction during the quarter (approaching 0.307 basis points), which can be attributed to the prevalent volume discounts offered by the exchange. The effective fee rate is expected to stabilize near current levels, with the overall derivatives revenue outlook dependent on future volatility and product mix changes. Near-term volumes are expected to recover slightly, bolstered by the launch of new products aimed at attracting broader trading interest, such as new FX futures contracts.
FY2025 Forecast Revision
Due to the better-than-expected results, primarily in Operating Revenue and Operating Income, JPX revised its consolidated earnings forecast for the fiscal year ending March 31, 2026 (FY2025 Full Year Forecast).
The forecast reflects an expectation that average daily trading value/volume for cash equities and TOPIX Futures will exceed previous estimates, while Financial Derivative volumes (Nikkei 225 Futures) were slightly lowered.
The dividend forecast remains unchanged at JPY 50.0 per share, maintaining a target payout ratio of approximately 80%.