Morningstar: Japan ETF Market Q2 2026 Flow Analysis


Exchange-Traded Fund (ETF) flows in the Japanese equity market have evolved into a primary battlefield for institutional liquidity, serving as a high-frequency barometer for professional sentiment. As of June 30, 2026, the second quarter has revealed a massive reshuffling of capital, where the ability of a product to facilitate large-scale, efficient entry and exit has become the ultimate differentiator. These flows represent institutional rebalancing and a concentrated pivot toward a narrow set of core benchmarks.
The data for the first half of 2026, as laid out in a recent Morningstar Research report, illustrates a market defined by extreme bifurcation. While total industry assets remain substantial, the internal dynamics reveal a sharp divide between "liquidity hubs" attracting significant capital and legacy providers facing heavy redemptions.
Significant Shifts in AUM and Market Share (Q2 2026)
- Aggressive Asset Concentration: The market has hit a point of extreme top-heaviness, with the ten largest ETFs capturing 85% of all flows, leaving niche products to fight for the remaining 15%.
- MUFG’s Ascension: Captured the market's highest positive flows (+4,878 billion yen), successfully positioning itself as the primary destination for capital rotating out of traditional leaders.
- NZAM’s Exponential Scaling: Recorded a surge in inflows that nearly doubled its total AUM year-on-year, signaling a disruption in the mid-tier competitive landscape.
This granular shift in capital reveals a market where liquidity is the ultimate currency, favoring managers with the deepest index-tracking capabilities and forcing a reckoning for firms unable to stem the tide of redemptions.
1. Competitive Analysis: Asset Manager Winners and Losers
In an increasingly concentrated ETF environment, market share retention is no longer guaranteed by brand history. As institutional investors consolidate their holdings into a handful of high-volume vehicles, asset managers are finding that scale and index positioning are the only viable defenses against aggressive redemption pressure.
The following table summarizes the performance of the leading asset managers through June 30, 2026:
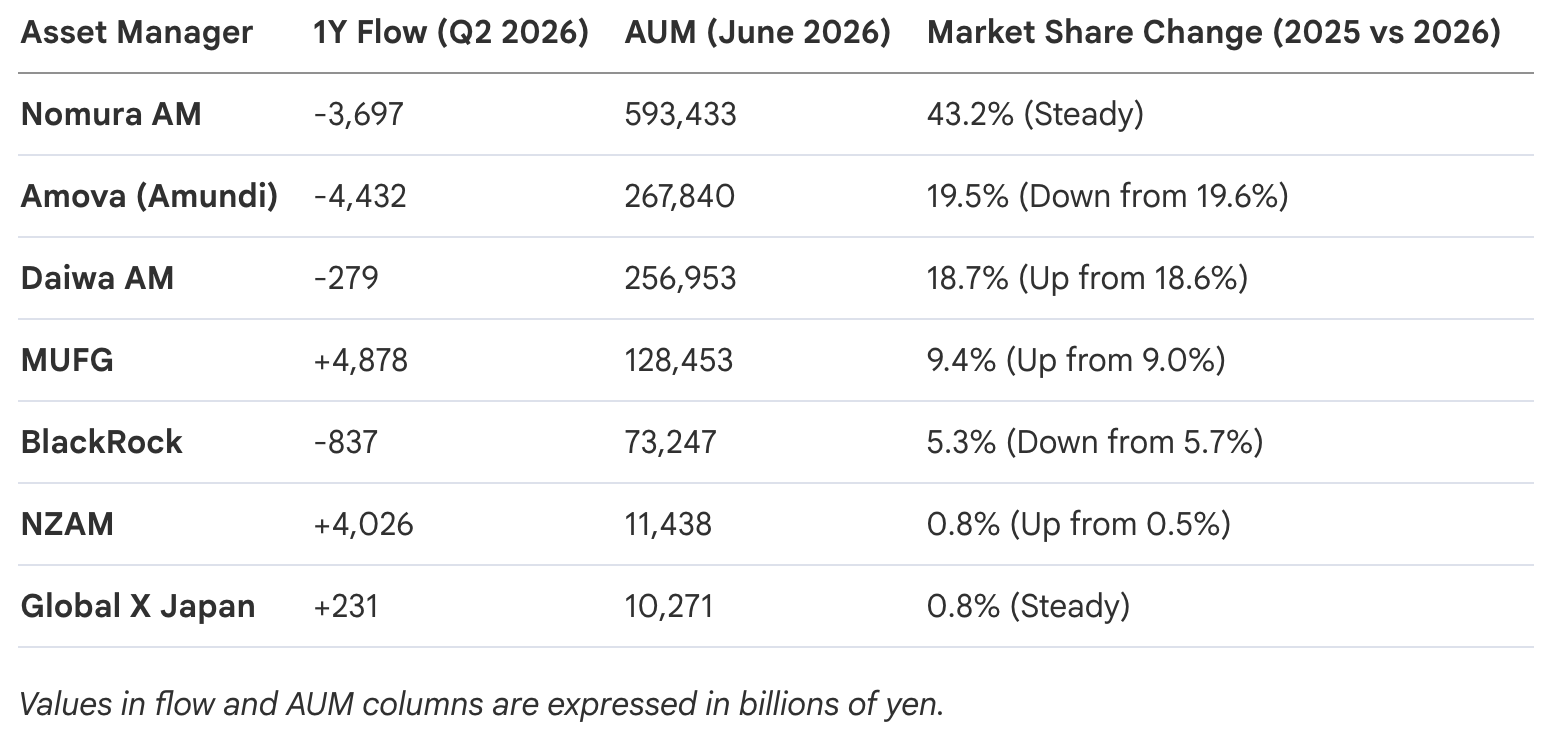
The divergence in performance is stark. MUFG stands out as the quarter's clear victor, recording massive inflows of +4,878 billion yen. More importantly, its AUM surged by 53.6% over the last year (from 83,583 to 128,453), a remarkable growth rate for a large-cap manager. This indicates a successful capture of capital rotating toward core liquidity vehicles. In contrast, traditional titans Nomura AM (-3,697 billion yen) and Amova/Amundi (-4,432 billion yen) are facing severe redemption pressure. While their AUM bases remain large, the persistent outflows suggest a "liquidity drain" as institutional traders migrate toward competitors.
Notably, Daiwa AM managed a slight market share gain (from 18.6% to 18.7%), demonstrating resilience in a volatile period. The rise of Norinchukin Zenkyoren Asset Management (NZAM) further complicates the hierarchy; by securing +4,026 billion yen in yearly flows, it nearly doubled its AUM from 4,977 to 11,438. These shifts are being catalyzed by a structural preference for specific products designed for high-frequency institutional use.
2. Product Concentration and Index Trends
The Japanese ETF market is currently grappling with heightened "concentration risk." As capital pools into a select group of flagship products, the ecosystem is becoming more efficient for institutional execution but more structurally reliant on a few core benchmarks. This trend of 銘柄集中度 (Product Concentration) has reached a zenith, with the "Top 10" ETFs accounting for approximately 85% of total market flows.
Dominance of Core Benchmarks and Tactical Trading
The concentration is largely a function of "Period-end/Short-term trading" (期売買). Institutional investors are increasingly using these ETFs as tactical vehicles for end-of-period rebalancing and short-term liquidity management, which naturally directs capital into the most liquid index-trackers.
The dominance of specific indices is summarized below:
- Nikkei 225 Trackers: This remains the most crowded segment of the market. Notably, 5 of the Top 10 ETFs are Nikkei 225 trackers. Dominant products include the iFreeETF Nikkei 225 with flows of 1,745 billion yen and the NEXT FUNDS Nikkei 225 with 1,641 billion yen.
- TOPIX Vehicles: The NEXT FUNDS TOPIX ETF continues to serve as the market's primary liquidity vessel for broad-market exposure, contributing 506 billion yen in quarterly flows.
- JPX 400 Products: While often overshadowed by the Nikkei and TOPIX, these products saw consistent activity, recording flows of 503 billion yen.
This landscape confirms a market bifurcated between high-volume trackers used for institutional tactical trading and specialized products that are increasingly marginalized.
3. Strategic Implications for the Japanese ETF Landscape
At the close of 1H 2026, the Japanese ETF ecosystem remains robust in scale, but its internal architecture is undergoing a profound transformation. The health of individual asset managers is now dictated by their grip on 銘柄集中度 (Product Concentration). The trend toward using ETFs for 期売買 (Period-end/Short-term trading) has created a "winner-takes-all" dynamic, where the most liquid vehicles capture the vast majority of capital.
For asset managers, survival requires either dominating the broad-market liquidity hubs or finding a niche that is immune to the rotation toward these massive index trackers. As the market moves into the second half of 2026, the gap between the high-growth challengers and the redemption-heavy legacy leaders is expected to widen further.
Outlook
The Q2 2026 data confirms a fundamental power shift. Traditional industry leaders like Nomura Asset Management and Amova are under significant redemption pressure, signaling that historical dominance is no longer a shield against shifting institutional preferences. Conversely, MUFG and NZAM have emerged as aggressive challengers, capturing the lion’s share of new capital by aligning with the trend toward high-liquidity index vehicles. For the remainder of 2026, the critical question is whether Nomura and Amova can innovate their product suites to stem the outflows, or if the market has permanently consolidated around a new set of liquidity leaders.
 Norbert Gehrke