Morningstar: Japan ETF Market Q1 2026 Flow Analysis


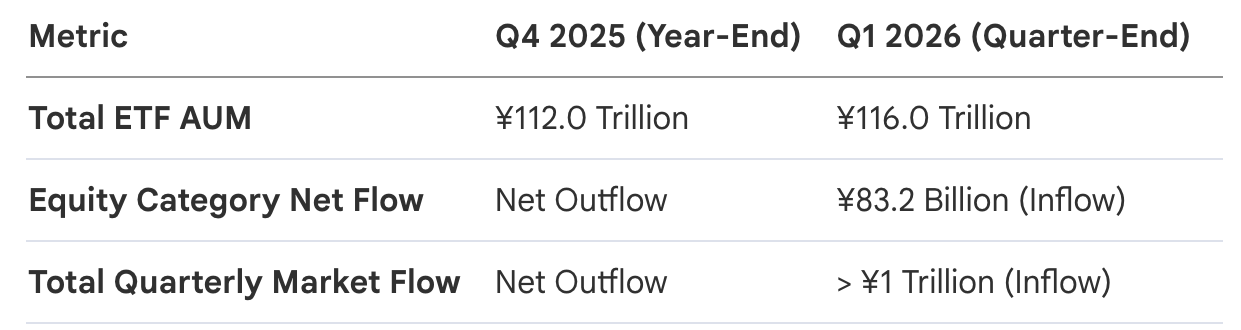
The Japanese ETF market ended a grueling three-quarter streak of net outflows with a commanding recovery. Total net inflows surged past the ¥1 trillion threshold, lifting total assets under management (AUM) to ¥116 trillion—a notable jump from the ¥112 trillion recorded at the end of 2025. This resurgence is a critical indicator of investor sentiment across the broader Asian landscape; rather than retreating from the market soft patch in March, capital allocators demonstrated highly opportunistic behavior, using the ETF vehicle’s liquidity to execute "buy the dip" strategies during localized corrections. Beneath this headline snapback, the market plumbing reveals a sophisticated rotation into yield-sensitive sectors and defensive commodities.
Asset Class Performance and AUM Trajectory
While the broader equity markets faced an adjustment phase in March, the quarter was defined by a resilient rebound in equity-linked vehicles. The equity category, which had been plagued by persistent outflows throughout 2025, reversed course to post a net inflow of ¥83.2 billion. This pivot underscores a shift in how institutional players view the Japanese recovery: the volatility in March was treated as a tactical entry point.
This tactical repositioning was facilitated primarily through high-velocity instruments, specifically leveraged products and commodity-backed vehicles, which allowed investors to amplify their exposure or hedge macro risks with precision.
Sector Spotlight: Tactical Leverage and Structural Gold Demand
The quarter’s activity was dominated by two disparate impulses: aggressive speculation and structural de-risking. The "Trading/Bull-Bear" category led all inflows at ¥291.4 billion. Investors utilized these leveraged tools for contrarian positioning during the March volatility, essentially betting on a rapid recovery of core indices.
Simultaneously, the "Commodity" category saw ¥284.9 billion in flows. Unlike the speculative surges seen in leveraged equities, demand for the Physical Gold ETF (Domestic/Physical Storage) remained remarkably stable throughout the quarter. This suggest a structural shift in portfolio construction; Japanese investors are increasingly viewing gold as a permanent hedge against persistent inflation and geopolitical instability.
Top 5 Inflow Categories (Q1 2026)
- Trading / Bull-Bear: ¥291.4 Billion
- Commodities: ¥284.9 Billion
- Domestic Equity (Specific/Sector): ¥263.0 Billion
- Domestic Equity (Large Blend): ¥260.9 Billion
- Domestic Equity (Large Growth): ¥240.9 Billion
The Fund Leaderboard: Yield-Sensitivity and Core Migration
The fund-level data highlights a massive sentiment reversal in the financial sector. The NEXT FUNDS TOPIX Banks Index ETF surged to the #1 spot for net inflows, drawing approximately ¥220.3 billion. This is a dramatic turnaround from Q4 2025, when the same fund was the market’s #2 net outflow vehicle. This volatility serves as a clear macro-proxy for shifting Bank of Japan (BoJ) interest rate expectations; institutional investors are aggressively positioning for margin expansion as the era of negative rates recedes into the background.
Furthermore, we are observing a migration within domestic equity vehicles. While the "One ETF TOPIX" saw a significant outflow of ¥52.7 billion, the "iShares Core TOPIX ETF" captured ¥105.8 billion in fresh capital. This suggests that wealth managers and institutional desks are consolidating holdings into "Core" building blocks that offer superior liquidity and lower cost structures.
Top 5 Funds by Net Inflow (Q1 2026)
- NEXT FUNDS TOPIX Banks Index ETF: ¥220.3 Billion
- NEXT FUNDS Nikkei 225 Leveraged Index ETF: ¥215.1 Billion
- Physical Gold ETF (Domestic): ¥163.7 Billion
- iShares Core Nikkei 225 ETF: ¥112.0 Billion
- iShares Core TOPIX ETF: ¥105.8 Billion
Bottom 5 Funds by Net Outflow (Q1 2026)
- One ETF TOPIX: -¥52.7 Billion
- MAXIS Nikkei 225 ETF: -¥27.0 Billion
- NEXT FUNDS TOPIX REIT Index ETF: -¥20.5 Billion
- NZAM TOPIX REIT Index ETF: -¥20.4 Billion
- iShares US Treasury 20+ Year Bond ETF (Hedged): -¥19.7 Billion
Competitive Landscape: Issuer Market Share and Concentration
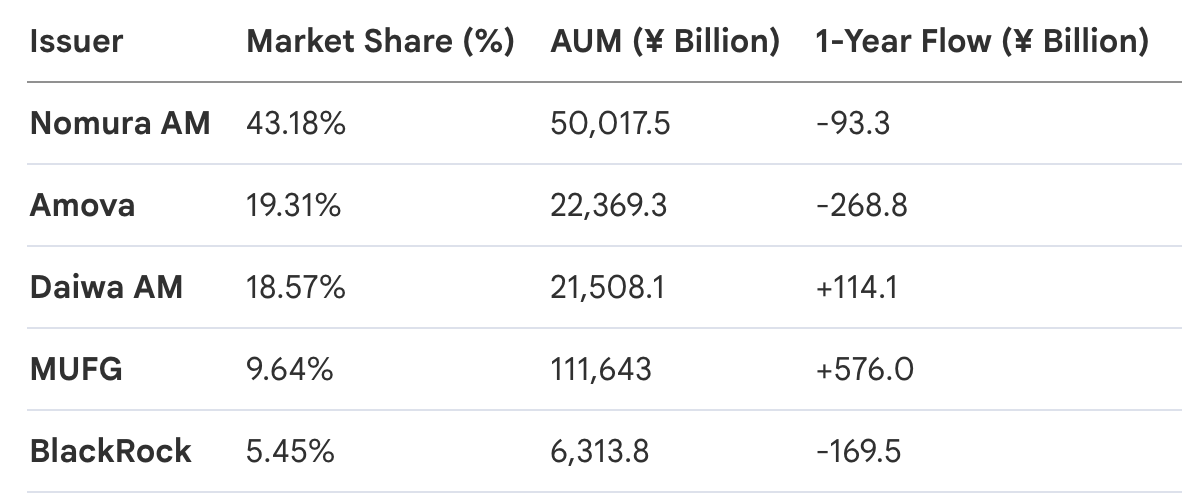
The Japanese ETF landscape remains a fortress of concentration, with the top five issuers commanding the lion's share of the ¥116 trillion market. Nomura Asset Management maintains its heavy-weight status with a 43.18% share, though it continues to see a moderate annual attrition in flows. In contrast, specialized entrants like Global X Japan and Simplex are showing significant momentum. Simplex, in particular, successfully reversed its trajectory, moving from a net outflow in Q1 2025 to a ¥43.6 billion inflow this quarter, illustrating the growing demand for niche, high-conviction strategies.
Structural Divergence: Tactical Proxies vs. Retail Stability
A fundamental structural divide has emerged in the Japanese investment complex. The high-velocity volatility of ETF flows is a direct byproduct of their role as a tactical proxy for global institutional and foreign investors. According to February 2026 TSE data, these participants drive the bulk of ETF volume, seeking rapid entry and exit points to navigate macro shifts.
Conversely, public mutual funds provide the market’s "domestic retail floor," characterized by far more stable, consistent flows. This stability is largely reinforced by the expansion of NISA (Nippon Individual Savings Account) accounts. However, the restrictive "Tsumitate" (installment-style) NISA framework continues to limit ETF eligibility, effectively cementing the ETF's position as a professional tool for short-term tactical positioning rather than a primary vehicle for long-term retail wealth accumulation. As we navigate past the ¥116 trillion mark, the ETF will likely remain the primary lightning rod for macro volatility in Japan, while traditional mutual funds sustain the long-term asset formation of the domestic household sector.