Tokyo’s Emergence as the Developed World’s Value Hub

The release of Deutsche Bank’s "Mapping the World’s Prices - 2026" report confirms a full inversion in the global macroeconomic landscape: the definitive redrawing of the cost-of-living map. Since this index began in 2012, Tokyo has transitioned from a symbol of prohibitive expense to the developed world’s most significant structural outlier in pricing. While the inaugural 2012 report captured a "Peak Yen" environment and a historically cheap US Dollar, the 2026 data presents the exact opposite. Japan has emerged as the subject of a remarkable structural repricing, offering a value proposition that is unparalleled among tier-one financial hubs. This inversion is positioning Tokyo as a premier value destination in a world of soaring global costs.
1. The Mechanics of Depreciation: PPP and Currency Divergence
Determining global competitiveness and institutional investment exposure necessitates a rigorous evaluation of Purchasing Power Parity (PPP) and exchange rate divergence. On a PPP basis, the USD has reached a "Peak USD" state, becoming more expensive relative to every one of the 42 economies tracked in this study over the last decade. The most jarring data point in this global realignment is the collapse of Japan’s PPP-implied price level. Having stood at a staggering 173 in the mid-1990s and 125 in 2012 (relative to a US base of 100), it has plummeted to just 60 in 2026.
This divergence is fueled by a -51% decline in the Yen since 2012. While global peers aggressively normalized interest rates to combat post-pandemic inflation, Japan’s defiance of this trend has reinstated the Yen as the world's premier funding currency for carry trades. With local Japanese inflation remaining relatively subdued compared to elsewhere, Tokyo now represents an extreme outlier of affordability, a status that has a profound impact on the daily cost of consumer goods and discretionary services.
2. Consumer Value Analysis: The "Cheap Japan" Phenomenon
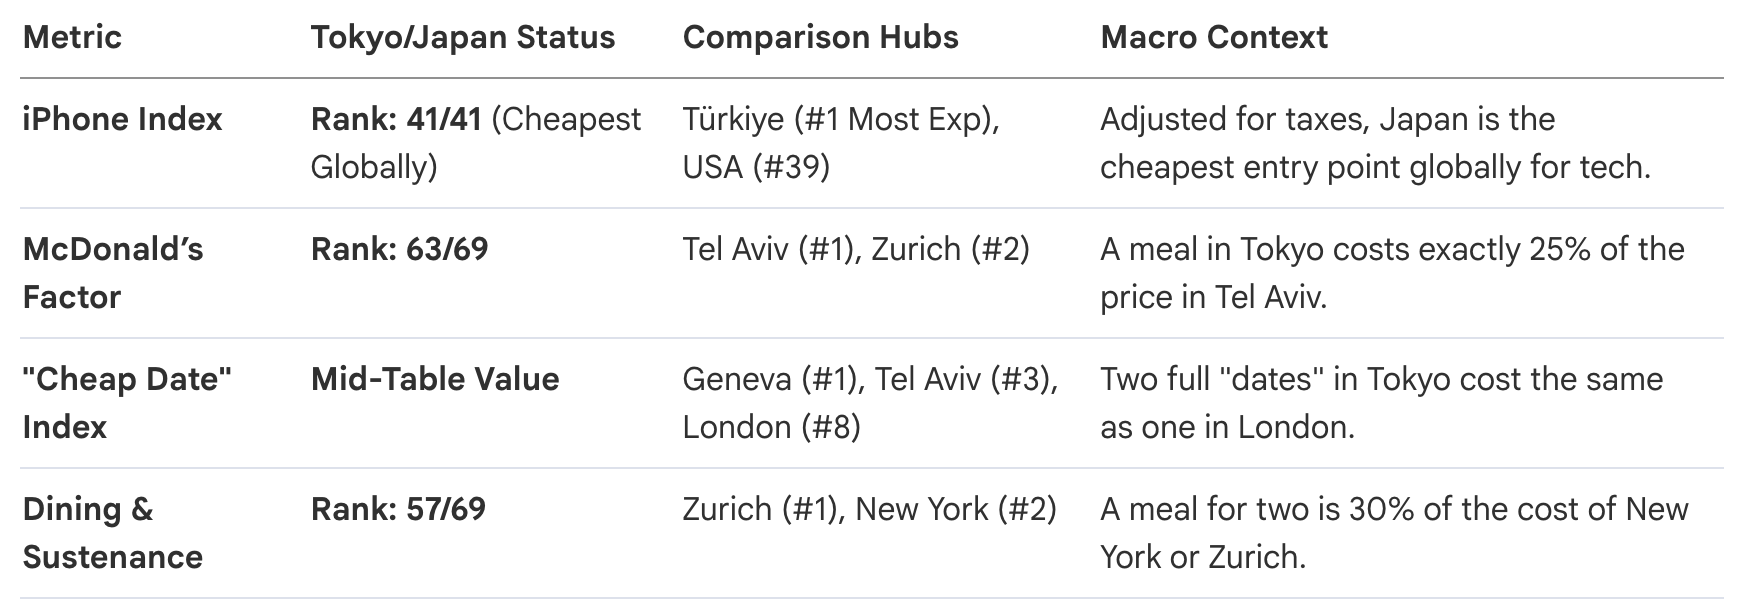
For global financial hubs, discretionary spending indices serve as critical proxies for a city’s standing and liveability. Tokyo’s 2026 rankings demonstrate a complete decoupling from its historical peers in the West and the Middle East.
Critical Takeaways on Tokyo’s Lifestyle-to-Cost Ratio
- Global Baseline for Tech: Japan and South Korea are the only tracked economies where an iPhone is cheaper than in the United States, contrasting sharply with Türkiye, where the same device costs 2.2x the US price.
- Sustenance Arbitrage: Tokyo’s dining costs are no longer comparable to tier-one hubs; a meal for two is now cheaper in Tokyo than in Warsaw, Prague, Istanbul, or Johannesburg.
- Discretionary Dominance: From coffee—where Tokyo is cheaper than 44 of the 69 focus cities—to fitness and leisure, Japan offers a high-quality lifestyle at a fraction of the cost of legacy hubs like London or Geneva.
3. Real Estate Paradox: Structural Declines in a Global Rally
Housing costs are the ultimate differentiator in "liveability" scores, often dictating the mobility of the global professional class. While property markets in rival hubs have surged, Tokyo presents a structural paradox. Tokyo’s buying prices per square meter are now nearly a third of Hong Kong’s and half of London’s.
The rental market is even more distinct: a 3-bedroom apartment in Tokyo (ranked 40th) costs approximately 25% of its equivalent in New York. While New York continues to lead the world in rental costs, Tokyo’s rental prices in USD terms have seen a -23% decline since 2016.
This property paradox transforms Tokyo’s standing in Quality of Life metrics. To understand the scale of Japan's anomaly, one must contrast Tokyo's -24% property price decline over the last decade against the tripling of prices (+209%) in Budapest or the doubling in Seoul. While legacy hubs like Paris (#43) and London (#47) see their liveability scores decimated by expensive housing and long commutes, Tokyo remains accessible to the professional class, offering world-class infrastructure without the "rent trap" seen in Singapore or Zurich.
4. Labor Dynamics: The Salary and Disposable Income Gap
True economic mobility is measured by "disposable income after rent." Tokyo presents a bifurcation in this category. Japanese salaries have historically lagged; Tokyo ranks 39th in net monthly salary with a -18% growth rate over the decade—the 5th smallest growth in the sample. This stands in stark contrast to the triple-digit wage growth seen in Central European hubs like Budapest (+161%) and Prague (+121%).
However, the market's bifurcation works in Tokyo’s favor regarding net retention. In New York, astronomical rents have neutralized high gross salaries, causing the city to plummet 12 places since 2012 to rank 39th in disposable income. Crucially, New York now lags 28 places behind Chicago (#11) in disposable income despite similar salary tiers. Tokyo, by contrast, remains "mid-table" (Rank #34) because its stagnant housing costs act as a safety net for disposable income, a luxury no longer available in London or San Francisco.
5. Comprehensive Japan Ranking Table (2026)
The following table standardizes Tokyo’s performance. Rank 1 = Most Expensive/Highest.
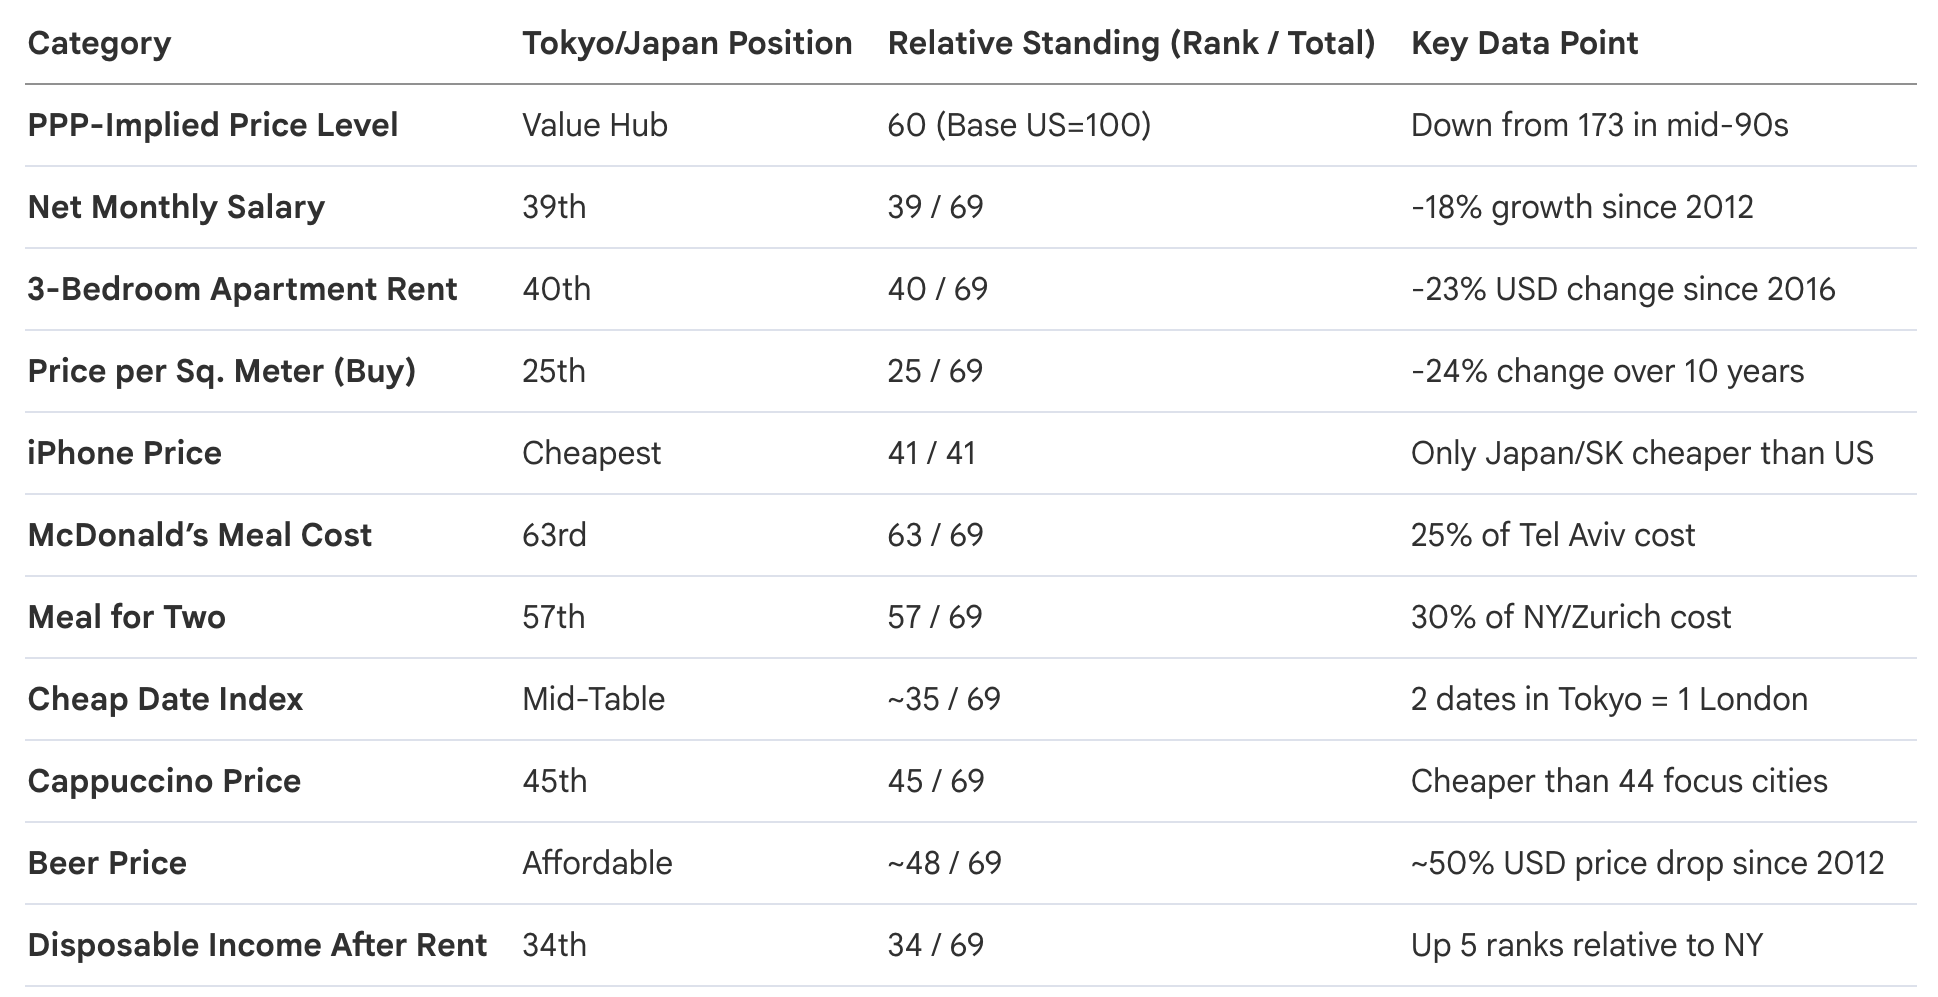
This data confirms that for those operating in USD-denominated environments, Japan has become the developed world's premier value destination.
6. Future Catalysts: AI Adoption and Mean Reversion
A senior macro view requires looking beyond static data to identify catalysts for mean reversion. The Nikkei 225’s +70% rally suggests the market is finally moving past decades of stagnation. The global AI boom serves as the specific catalyst that could reset Japan’s "cheap" status through a three-pronged strategy:
- Demographics as Necessity: Unlike the West, where AI is viewed as a displacement risk, Japan’s shrinking population makes AI an economic necessity. The government views AI as the primary tool to ease capacity constraints.
- Promotion-Oriented Policy: Japan aims to be the "most AI-friendly country in the world." Its strategy is defined by the 2025 AI Act and the AI Basic Plan, which focus on accelerating research and utilization rather than the restrictive, risk-based regulation seen in the EU.
- Physical AI Dominance: Japan is leveraging its legacy in industrial robotics and precision manufacturing to lead in "Physical AI"—integrating intelligence into factories, logistics, and healthcare.
7. Conclusion: The Value Proposition for Global Professionals
The 2026 findings are unequivocal: Japan has completed a decade-long structural repricing that has transformed it into the developed world’s value hub. The era of "Cheap Tokyo" offers a unique window of opportunity where premier infrastructure and quality of life are available at a massive discount relative to legacy hubs like New York, Zurich, or Tel Aviv.
For institutional investors and global professionals, the strategic directive for 2026–2030 is clear: exploit the current pricing gap before productivity-enhancing AI and manufacturing gains trigger a mean reversion. Organizations should recalibrate their Asia-Pacific footprints to leverage Tokyo's affordability and arbitrage the disposable income stability that Japan now offers relative to rent-burdened markets in Europe and the United States. Tokyo is no longer an expensive destination to be feared, but a value play to be aggressively utilized.
 Norbert Gehrke