The Japanese ETF Landscape in a Global and Regional Context


The ETF wrapper has fundamentally disrupted the architecture of global asset management; as of Q2/2026, we are witnessing a structural migration of capital into a $19.9 trillion powerhouse. This shift is driven by a sophisticated investor base that prizes the ETF for its transparency, intraday liquidity, and tax efficiency—qualities that traditional mutual funds struggle to replicate. The sustained 15-year streak of positive global inflows confirms that the ETF is the primary instrument for both tactical asset allocation and core institutional exposure.
At the mid-point of 2026, the global snapshot reflects a market of immense scale, featuring over 14,500 listed products. While the Americas maintain their historical dominance, the strategic narrative is shifting toward the high-growth potential of secondary regions as US markets approach maturity.
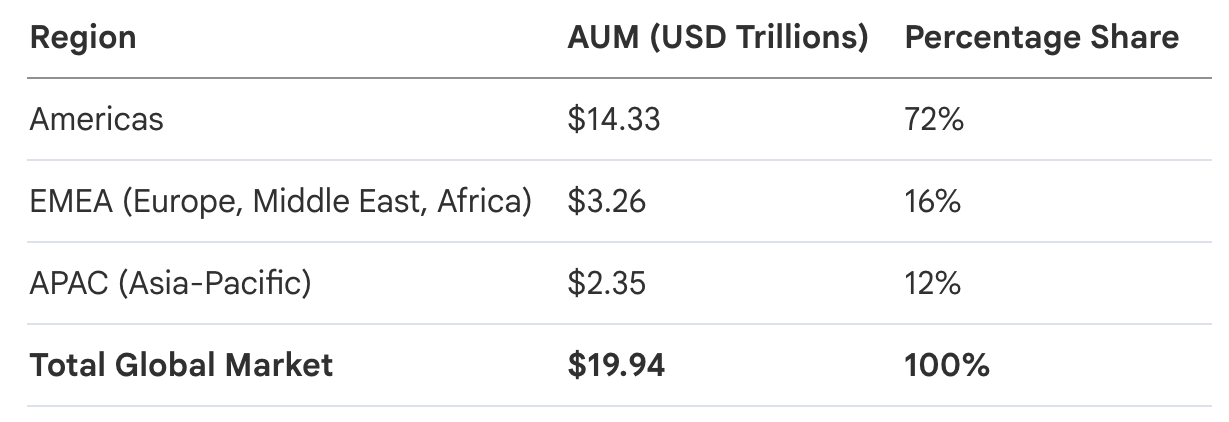
As US indices face potential saturation, the next major "Alpha Cycle" will be driven by the APAC region, where the rapid adoption of specialized vehicles is creating a new frontier for global investors.
1. The APAC Growth Engine: Regional Comparison
The Asia-Pacific region is currently the world’s most significant growth engine for ETFs. With a 25% CAGR over the last decade, APAC is outpacing the United States’ 20% growth rate. This acceleration reflects a maturing capital market environment where regional investors are increasingly "weaponizing" the ETF wrapper for targeted market access.
However, a granular look at the region reveals a glaring disparity we call the "Active Gap." While Japan remains the absolute AUM leader in APAC at $728 billion, its adoption of active strategies is anemic compared to its neighbors. In Taiwan, active ETFs represent a staggering ~33% of the total market, whereas Japan’s active segment accounts for a negligible 0.12% of its AUM.
Top 5 APAC Countries/Regions: The Active Penetration Gap
- Japan: $728 Billion (Active AUM: $909 Million — 0.12% penetration)
- China: $722 Billion (Active AUM: $151 Million)
- Taiwan: $256 Billion (Active AUM: $84 Billion — ~33% penetration)
- South Korea: $235 Billion (Active AUM: $63 Billion)
- Australia/New Zealand: $197 Billion (Active AUM: $33 Billion)
This disparity signals that Japan has historically been an "Index-First" market. While it matured early through massive scale, it is now a "late bloomer" in the active management revolution that is currently defining the Taiwanese and South Korean markets.
2. The Evolution and Maturity of the Japanese ETF Market
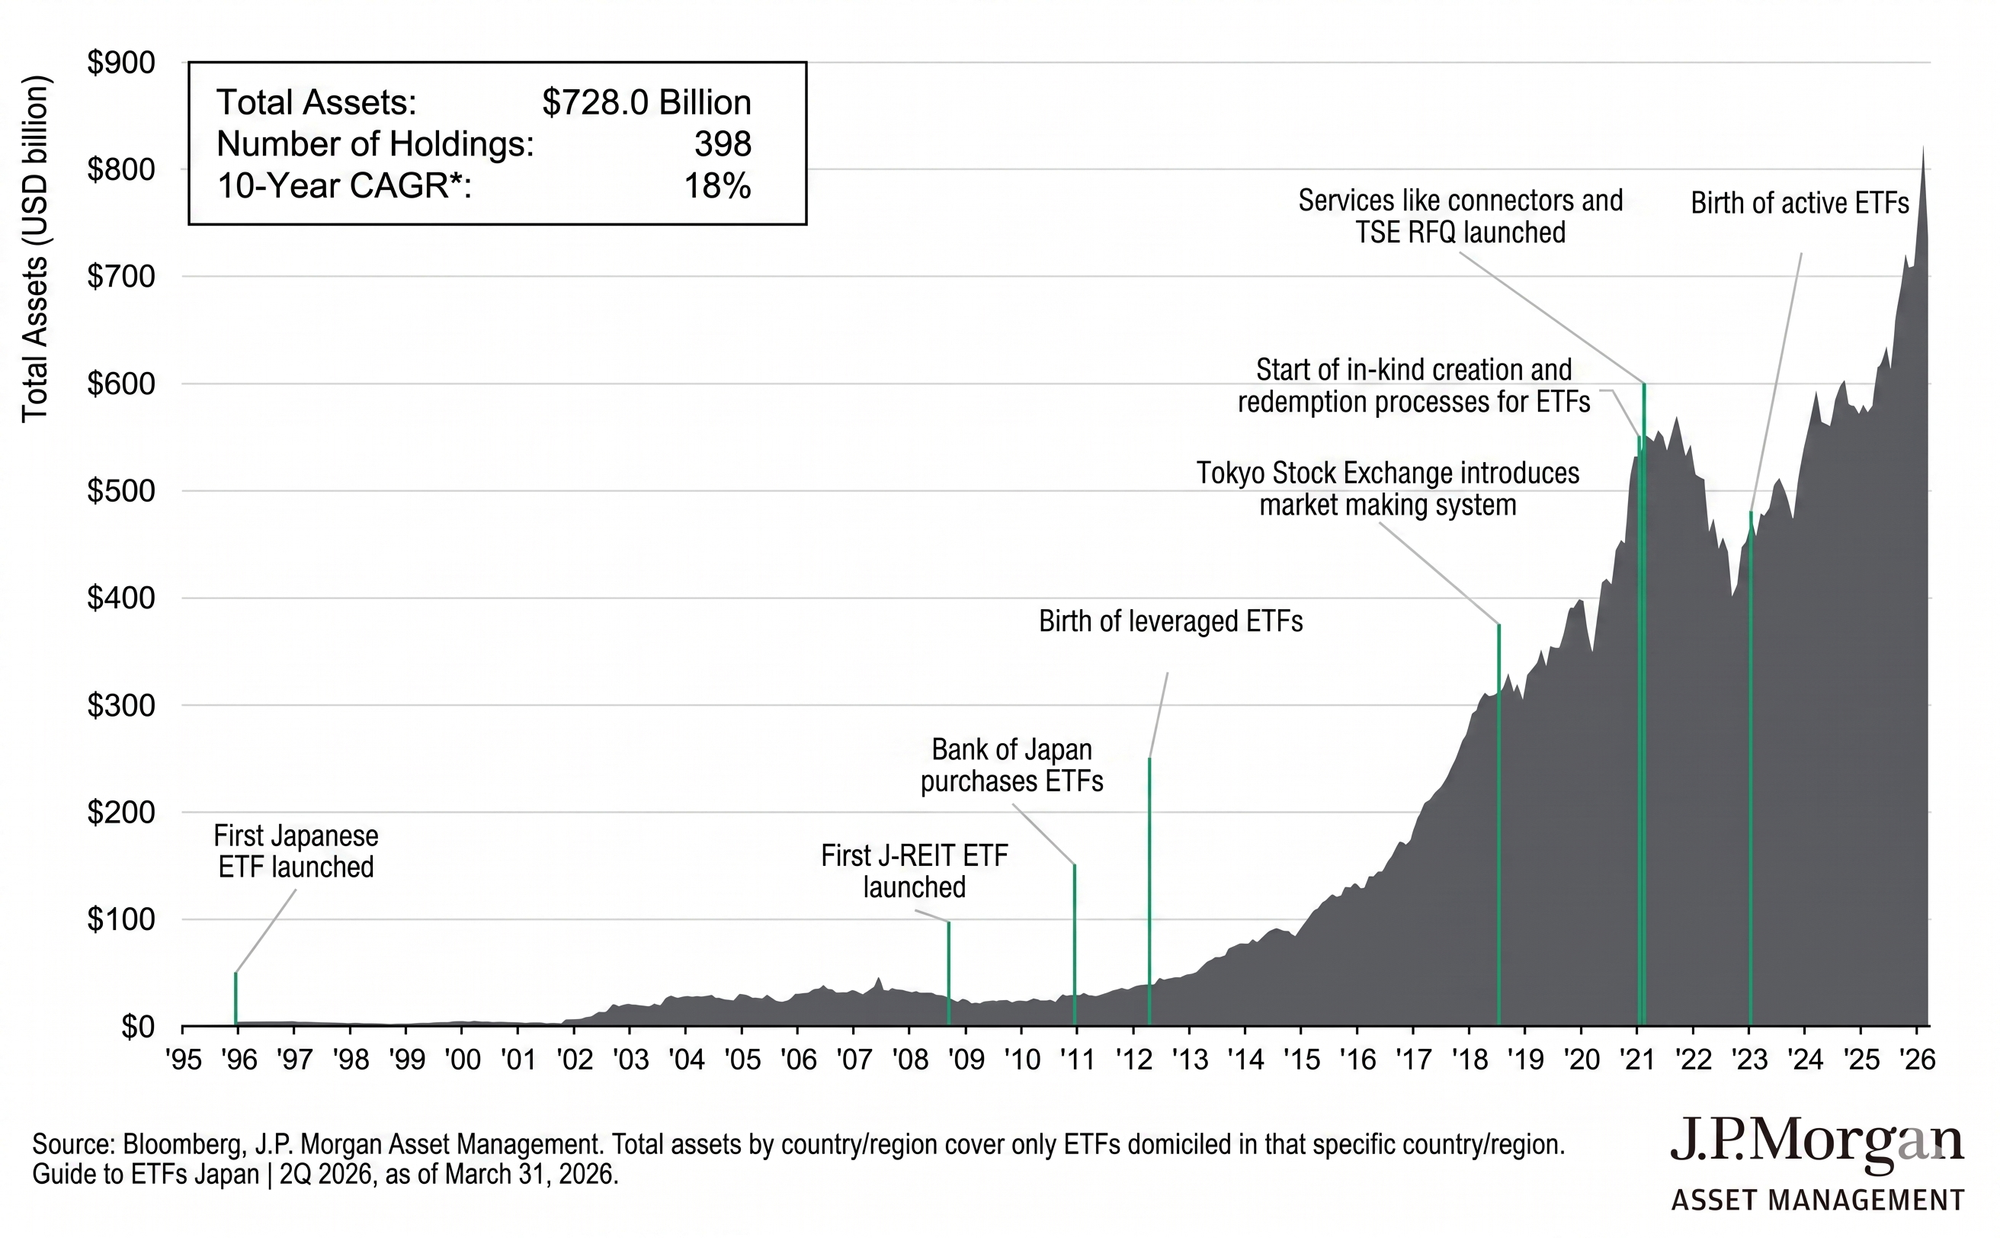
Japan’s journey from its first listing in 1995 to its current $728 billion status has been characterized by steady, structural growth (18% 10-year CAGR). However, the market’s history is inextricably linked to institutional intervention. The Bank of Japan (BOJ) involvement, beginning in 2010, acted as a massive liquidity backstop but simultaneously created a liquidity distortion. By favoring broad index-tracking products, the BOJ effectively anchored the market to passive strategies, suppressing the natural evolution of the active segment for over a decade.
Chronological Milestones of the Japanese ETF Market
- 1995: Birth of the inaugural Japanese ETF.
- 2007: Introduction of J-REIT ETFs (expanding into real estate).
- 2010: BOJ initiates direct ETF purchases, becoming a dominant market participant.
- 2012: Launch of leveraged ETFs to meet tactical/speculative demand.
- 2018: TSE implements the Market Making Scheme to deepen secondary market liquidity.
- 2023: The regulatory and structural birth of Active ETFs in Japan.
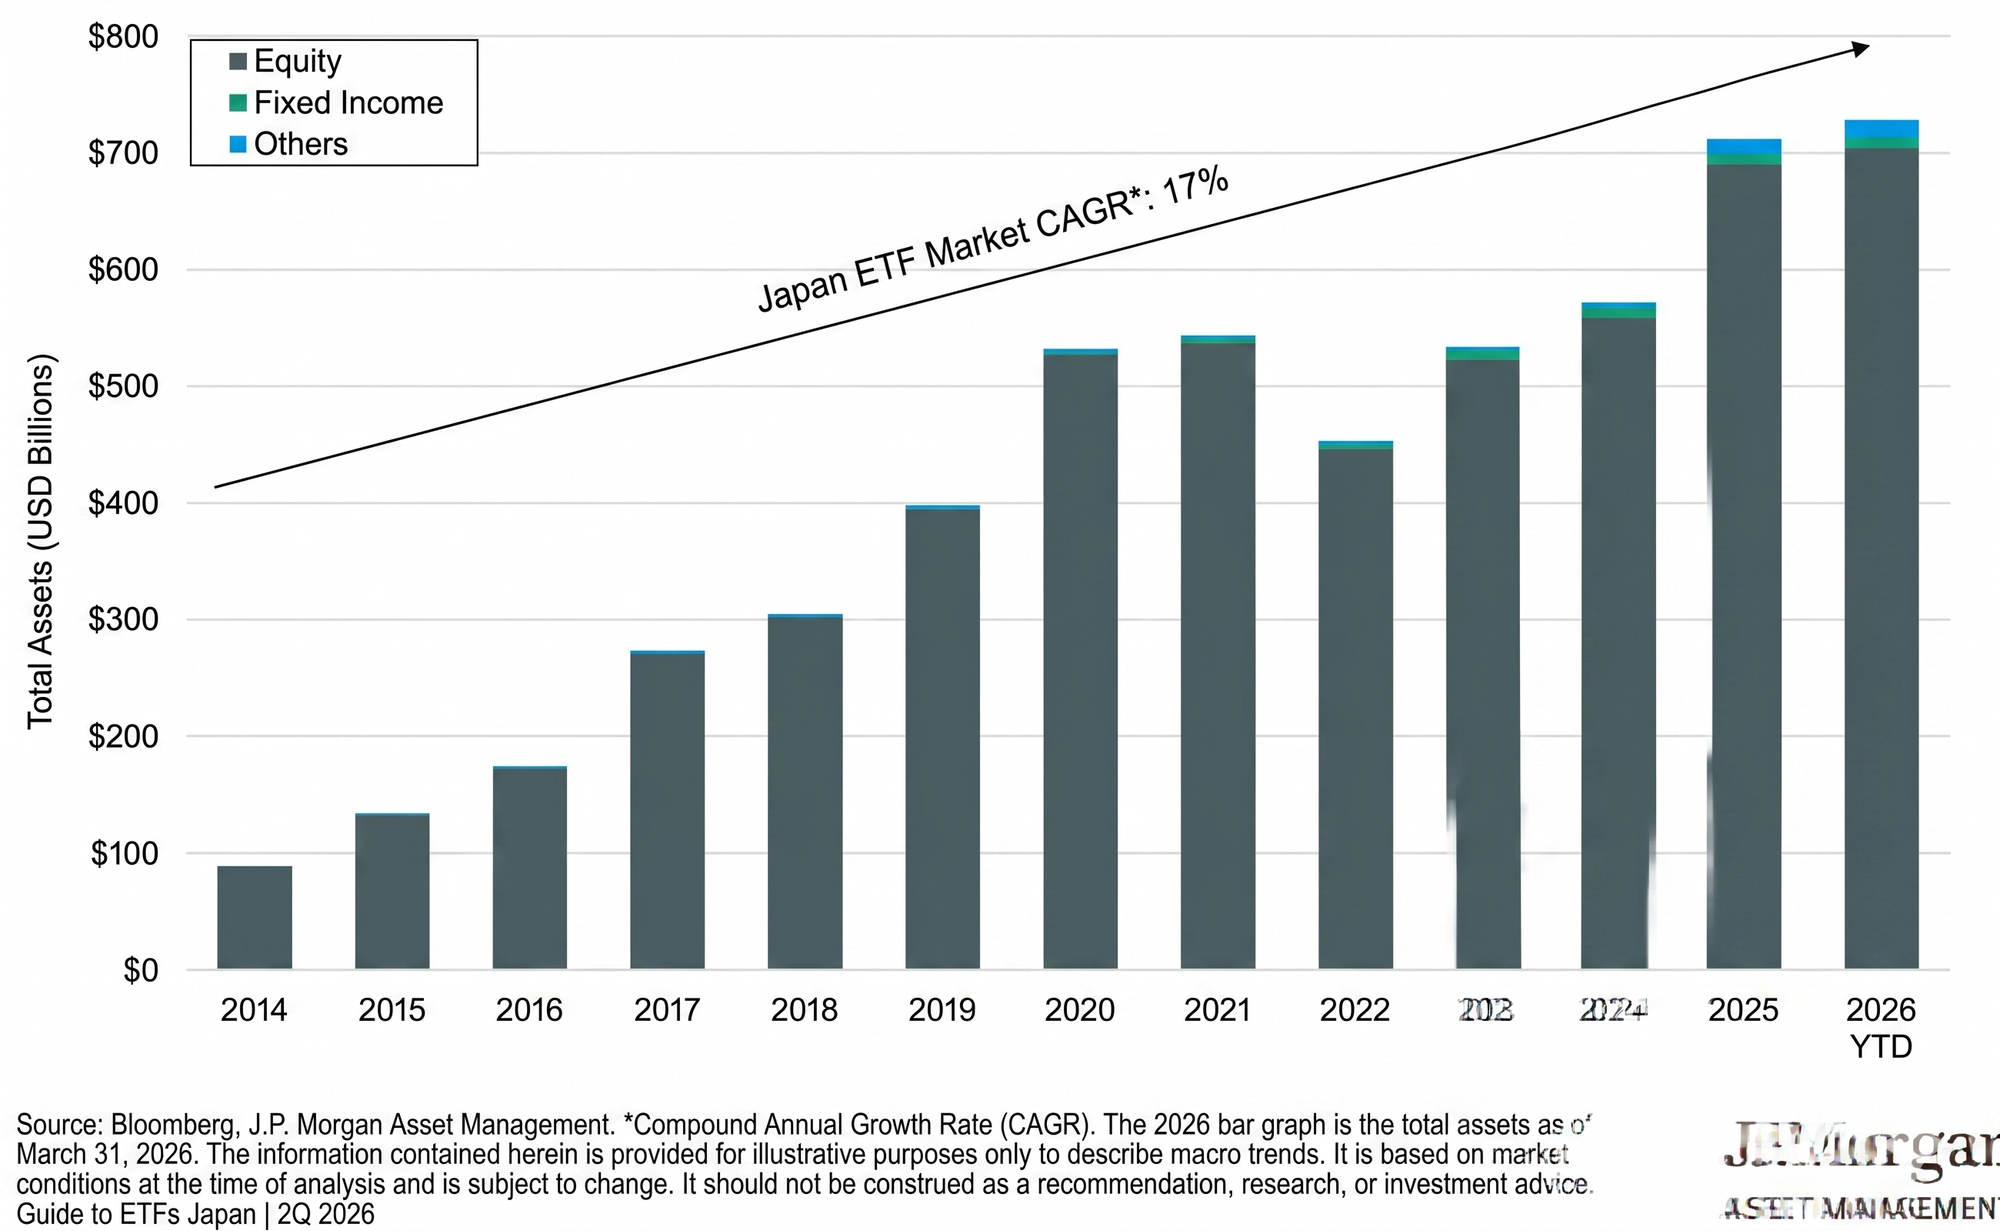
While the market remains equity-heavy, the "Other" category—which includes J-REITs and Commodities—has shown resilience, posting an 18% CAGR. We are finally seeing the market move past the "BOJ Anchor" toward a more diversified ecosystem.
3. Strategic Shift: The Rise of Active and Income-Oriented ETFs
The global pivot toward active ETFs is the most significant trend of 2026. While index-based ETFs still command 77% of global AUM, active ETFs are punching far above their weight, capturing 38% of all new ETF fund flows YTD. This reflects a definitive shift toward alpha generation within the transparent ETF vehicle.
A key driver of this shift is the demand for Derivative Income and Covered Call strategies. These products allow investors to navigate "volatile sideways" markets by generating alternative income through option premiums. In fact, "Derivative Income" strategies accounted for 13% of all YTD active equity inflows.
This explosion was made possible by the 2019 "ETF Rule" (SEC Rule 6c-11). By modernizing the regulatory framework and enabling "custom baskets," this rule set the global gold standard for transparency and efficiency. Japan is now following this modernization path, finally allowing active managers to bring their best strategies to the exchange without the historical constraints of index-tracking requirements.
4. Market Ecosystem: Liquidity, Arbitrage, and Resilience
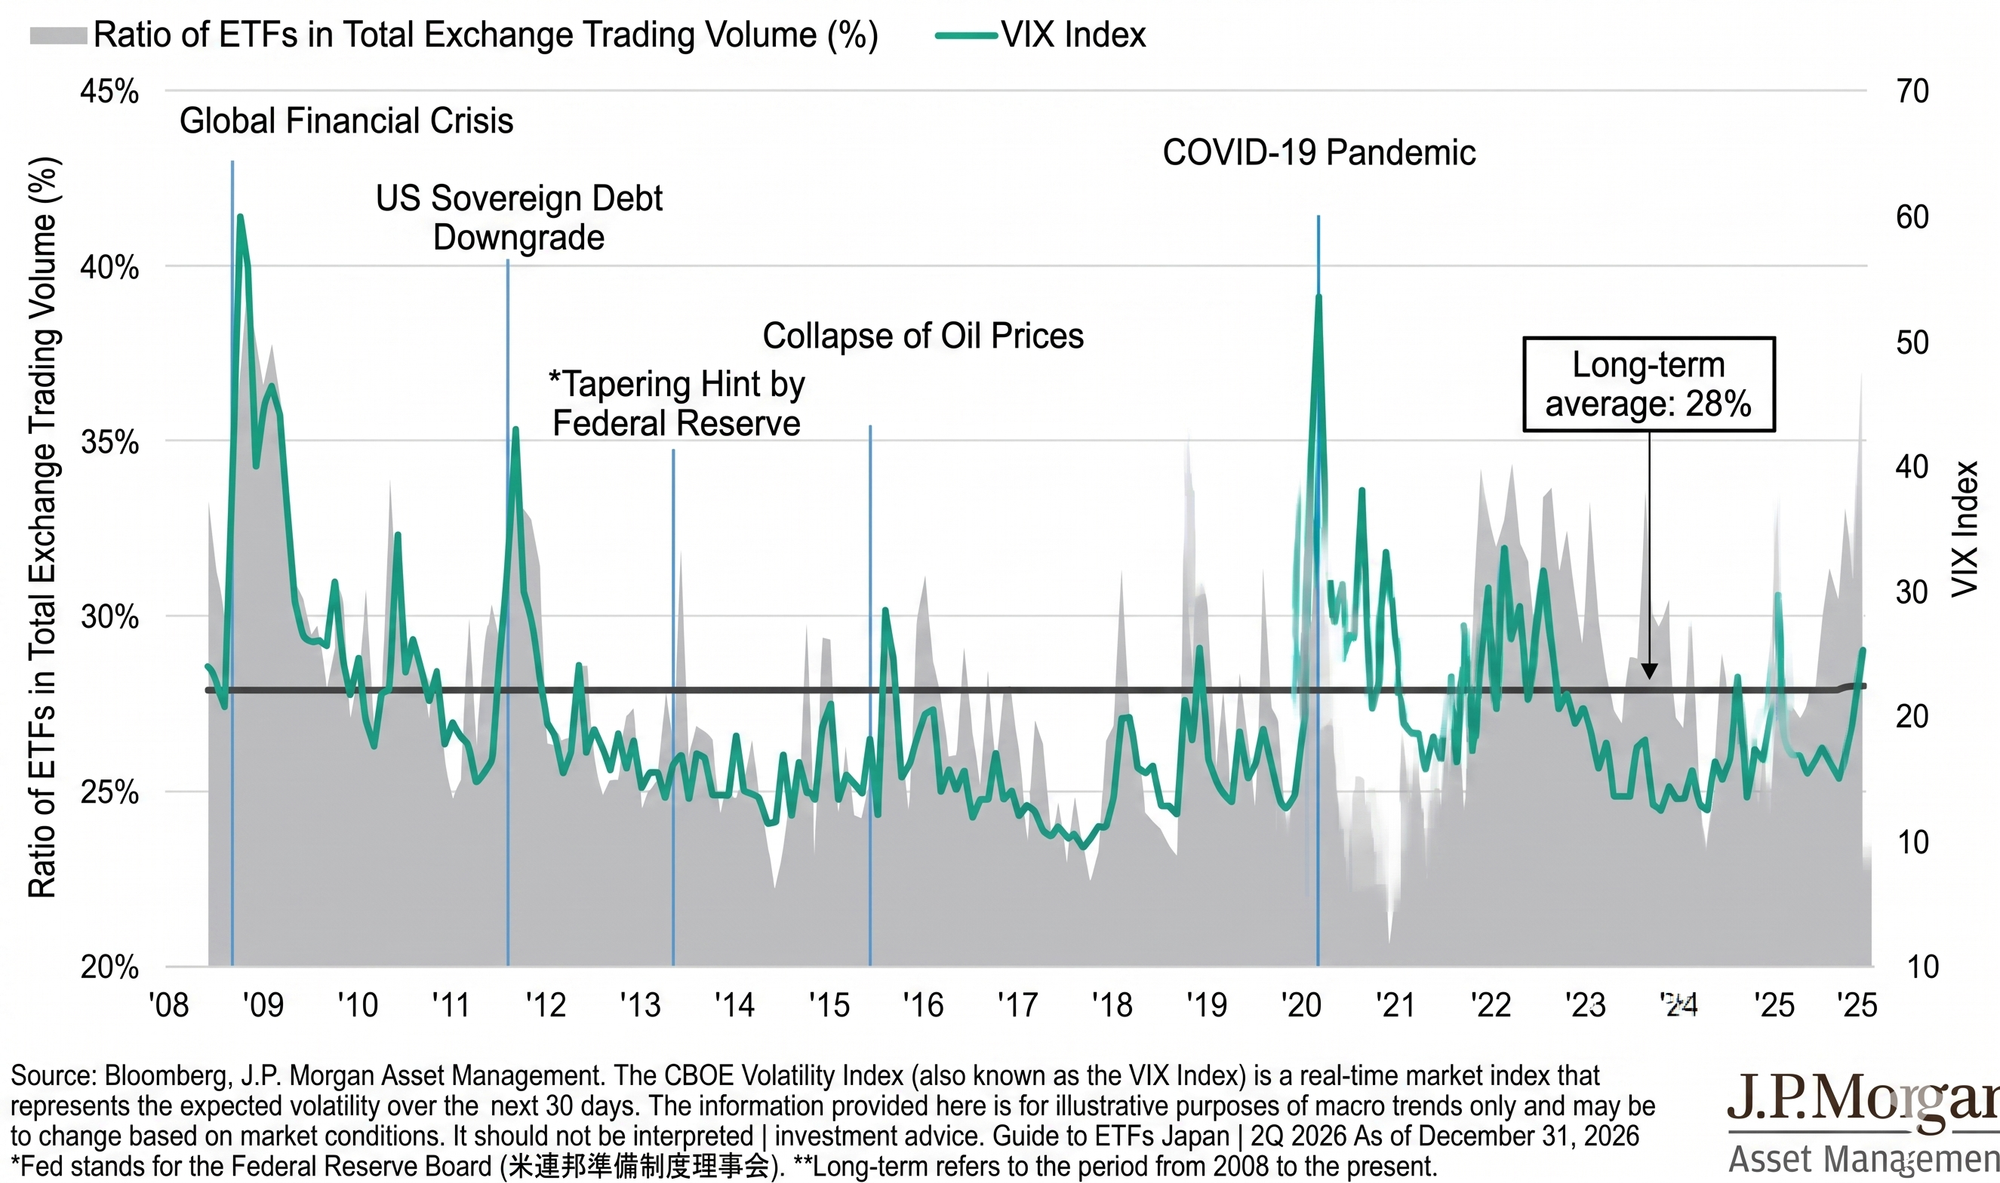
An ETF’s true liquidity is found in the "Ecosystem", the underlying assets and the arbitrage mechanism. During periods of extreme market stress, ETFs consistently demonstrate superior resilience. When the VIX spikes, ETF trading volume as a percentage of total exchange activity typically surges to ~40% (against a 28% long-term average), proving that the ETF is the market’s most reliable tool for price discovery during a crisis.
For the Japanese institutional investor, the "Active Bond" segment is particularly critical. Given the current global interest rate divergence, the ability to look "off-index" is a major competitive advantage. Currently, 48% of the $58 trillion US bond market sits outside the Bloomberg US Aggregate Index. Active bond ETFs allow managers to navigate this vast universe, providing essential duration management and yield capture that passive trackers simply cannot access.
The "Institutional Requirements" for Market Resilience
- Daily Transparency: Immediate visibility into underlying risk and exposure.
- Intraday Liquidity: The ability to execute tactical shifts in real-time.
- Low Cost: Drastically reduced fee drag compared to traditional active funds.
- Accessibility: Democratized access to complex institutional strategies (e.g., covered calls).
5. Conclusion: The Future Trajectory of Japan’s ETF Market
The Japanese ETF market is at a historical inflection point. While Japan is a regional leader in total AUM, it is just beginning its journey in the active space. The massive "Active Gap" (0.12% in Japan vs 33% in Taiwan) represents the single largest growth opportunity in the APAC region for the next five years.
The convergence of active management, innovative derivative income strategies, and a maturing active bond ecosystem will define the next decade of Japanese portfolio construction. As the market finally moves past its historical reliance on BOJ-supported index products, we expect a rapid catch-up to regional peers. The next evolution of the Japanese market will be defined by the search for alpha, and the ETF wrapper will be the primary weapon for the sophisticated 2026 investor.
 Norbert Gehrke