IMF Regional Economic Outlook for Asia and Pacific

The IMF's October 2026 Regional Economic Outlook for Asia and the Pacific arrives at a critical juncture for the global economy. As global activity navigates severe, compounding external shocks—including acute geopolitical escalation in the Middle East, persistent US tariff barriers, tightening monetary stances across major monetary authorities, and structural sovereign debt pressures—Asia continues to serve as the primary engine of global economic expansion.
The region's dynamic performance reflects a remarkable capacity to adapt to energy supply disruptions and capitalize on powerful structural tailwinds, notably an unprecedented global boom in artificial intelligence (AI) infrastructure and technology trade.
However, beneath this aggregate resilience lies widening economic divergence across sub-regions, sectors, and income groups. While technology-exporting advanced economies and systemic emerging markets have consistently outperformed expectations, low-income developing countries and Pacific Island economies confront severe stagflationary pressures. Managing these contrasting realities requires a rigorous baseline evaluation and a clear understanding of the macroeconomic mechanisms driving Asia's evolving growth path.
Core Growth Trajectory & Global Weight
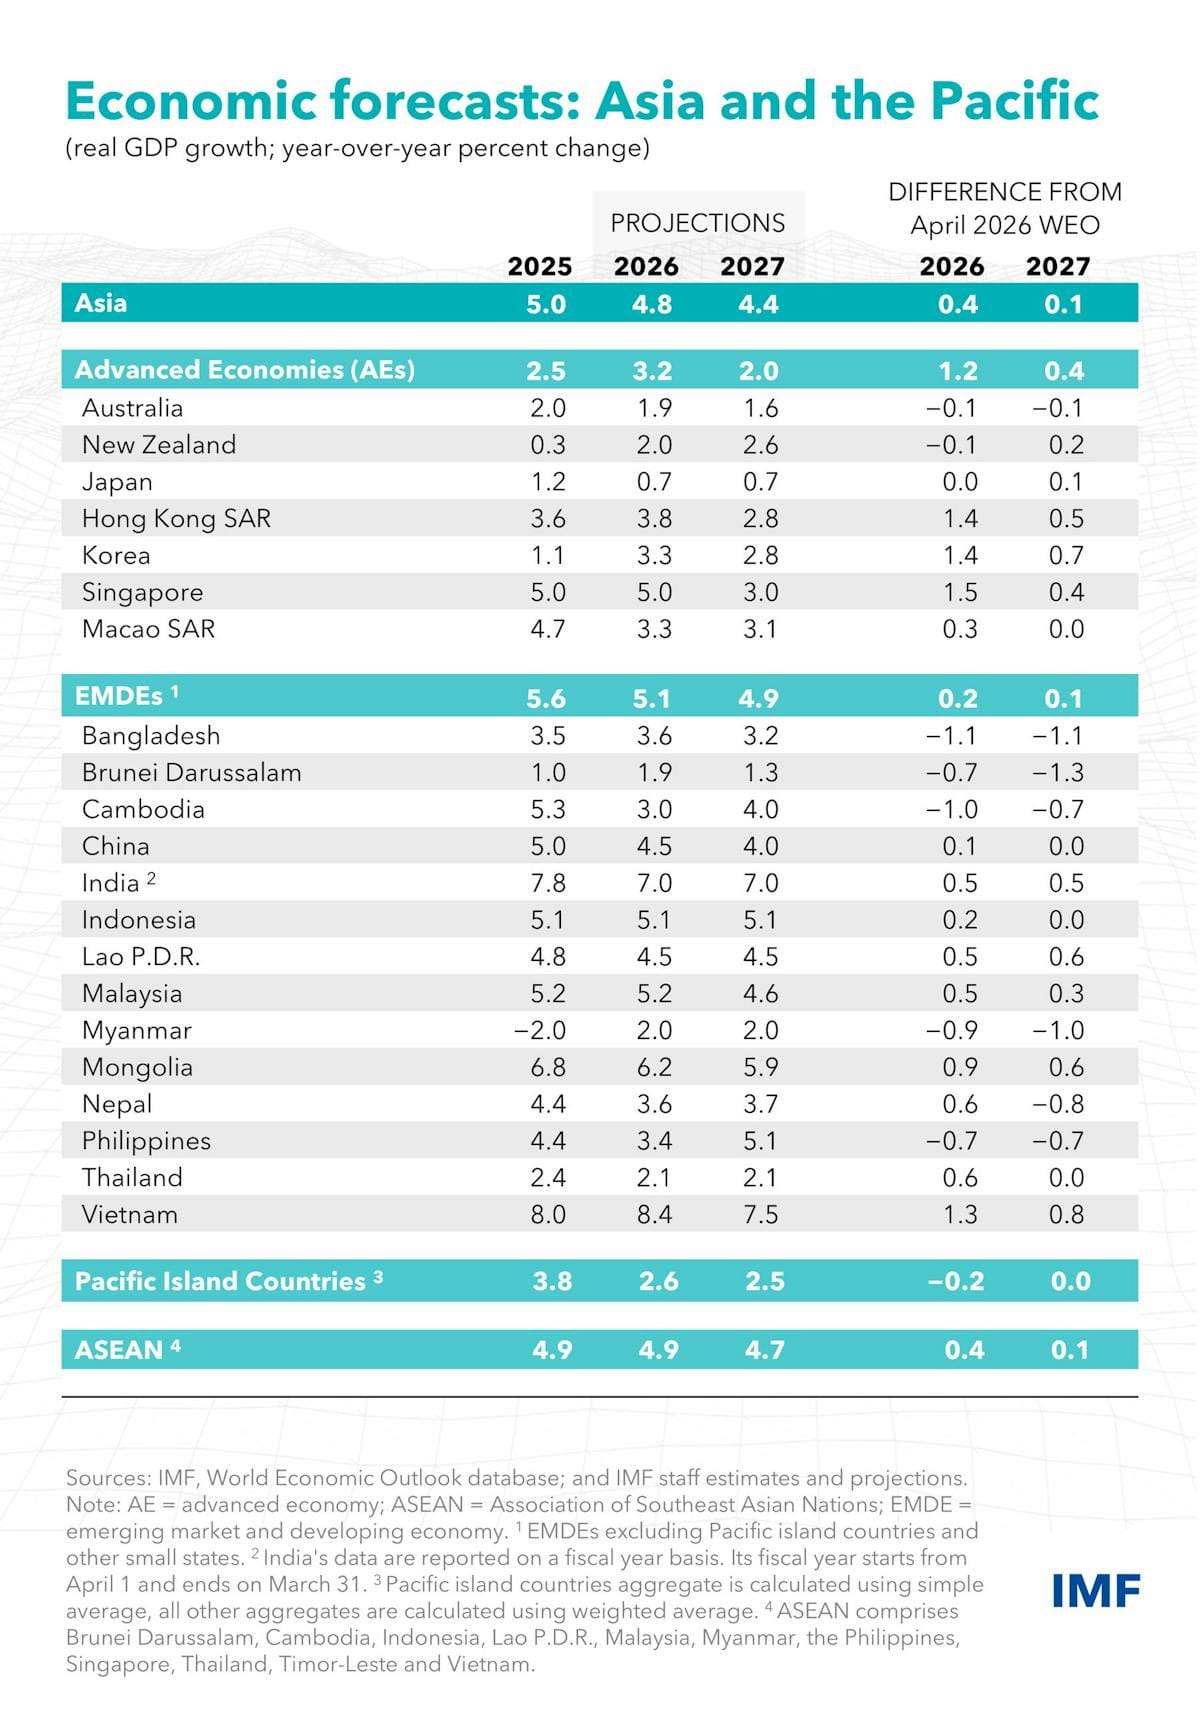
Asia's aggregate growth trajectory demonstrates extraordinary momentum relative to the global economy, even as baseline activity undergoes a planned moderation. Regional real GDP growth is projected to ease from 5.0 percent in 2025 to 4.8 percent in 2026, before further moderating to 4.4 percent in 2027. The 2026 forecast represents a substantial upward revision of 0.4 percentage points compared to the April 2026 World Economic Outlook (WEO) baseline of 4.4 percent, driven by stronger-than-expected first-half performance in technology-exposed advanced economies and major emerging market powerhouses.
Significantly, the Asia-Pacific region is projected to contribute 68 percent—more than two-thirds—of total global economic growth in 2026. This reinforces Asia’s position as the indispensable anchor of global aggregate demand. However, this regional expansion is highly asymmetric. Growth forecasts for advanced economies deeply integrated into the global technology value chain have been marked up sharply, whereas forecasts for vulnerable, energy-dependent, and non-tech economies have suffered severe markdowns.
The Three Macroeconomic Shocks/Forces
The regional macroeconomic narrative in 2026 is defined by the interaction of three central forces:
- The Middle East Energy Shock: Triggered by the escalation of conflict in the Middle East in February 2026, this shock hit a region with intense structural energy dependency. Energy reliance across Asia-Pacific stands at approximately 4 percent of GDP, with nearly half (2 percent of GDP) imported directly. While crude oil prices retreated from their initial April peaks, refined product prices—specifically diesel and jet fuel—experienced historically large spikes in crack spreads. Higher fuel, transport, and fertilizer costs have severely impacted imported energy-dependent economies, straining public balance sheets and elevating cost-of-living pressures.
- The AI-Driven Technology Boom: Accelerating rapidly from mid-2025, an unprecedented surge in global demand for artificial intelligence infrastructure provided a massive offset to energy headwinds. Strong global demand for advanced logic and high-bandwidth memory (HBM) chips, AI servers, and physical data center construction generated sharp terms-of-trade gains for key technology exporters, boosting regional capital expenditure, export volumes, and equity valuations.
- Trade Reconfiguration & Tariff Persistence: Despite the persistence of elevated US effective tariffs—averaging over 10 percent on Asia-Pacific overall and over 20 percent on China—and expanding non-tariff restrictions, regional trade volume has proven remarkably resilient. Non-technology exports held up better than anticipated, supported by the reorientation of Chinese export flows toward alternative global markets, robust intra-Asian supply chain trade, and the deepening of approximately 20 bilateral and multilateral trade agreements ratified or entering into force during 2025–2026.
Simultaneously, long-term sovereign bond yields across Asia have surged by 40 to 60 basis points in 2026. This upward shift is driven primarily by an expansion in global term premia, resulting from heavy sovereign debt issuance in major advanced economies (US, EU, Japan) and financial crowding-out from massive corporate bond issuance by AI-tech conglomerates.
Having established the aggregate growth baseline and global risk parameters, it is necessary to examine the underlying supply-chain, sectoral, and policy mechanisms driving these divergent economic outcomes across the region.
1. Deep Dive into Structural Drivers & Sectoral Divergence
The sharp contrast in economic performance across Asia-Pacific economies is rooted in three structural mechanisms: varying operational capacities to adapt to severe energy shocks, differing degrees of integration into the global technology ecosystem, and the ability to leverage evolving intra-regional trade networks.
1.1 Energy Shock Adaptation vs. Fiscal Strain
Despite high energy import dependencies, aggregate Asian industrial output cushioned the initial impact of the Middle East energy crisis through rapid operational adaptation. Major industrial economies executed multi-pronged mitigation strategies:
- Strategic Inventory Drawdowns: Large economies, notably China, Japan, and Korea, strategically drew down domestic oil reserves to buffer industrial supply chains against immediate physical shortfalls and smooth extreme price volatility.
- Procurement Source Diversification: Refining centers in India, Japan, and Korea successfully shifted crude procurement toward non-Middle East suppliers, restoring total crude inflow volumes to pre-conflict baselines by June 2026.
- Alternative Fuel Substitution: Major industrial producers expanded the utilization of alternative domestic energy inputs, including renewable generation and domestic coal, while scaling back refinery runs and refined product exports to neighboring markets.
However, these temporary operational buffers disguise mounting policy limits and fiscal strain. Strategic inventory drawdowns are inherently finite; as reserves reach depleted levels, sovereign entities are compelled to re-enter spot markets, risking secondary price spikes. Furthermore, fiscal measures deployed to shield end-users—ranging from fuel tax cuts in Cambodia and Lao PDR to subsidy-backed retail price caps in Japan and Thailand—have generated substantial fiscal costs. Reported fiscal costs of energy shock mitigation measures reached 1.0 to 3.0 percent of GDP in lower-income and vulnerable economies, directly eroding primary balances.
This exposes a fundamental strategic choice between policy frameworks that "protect prices" versus those that "protect people":
- Protecting Prices: Broad-based fuel subsidies, tax cuts, and administrative price freezes blanket the economy with artificially low price signals. While suppressing near-term headline CPI pass-through, these measures carry escalating fiscal costs, disproportionately benefit higher-income households with higher fuel consumption, distort energy efficiency incentives, and delay essential demand adjustments.
- Protecting People: Targeted social protection leverages digital infrastructure, social registries, and direct cash transfers to shield vulnerable households and exposed small businesses. By allowing retail fuel prices to reflect global cost realities while cushioning income shocks for vulnerable populations, governments preserve market price signals, encourage energy conservation, and safeguard medium-term fiscal sustainability.
1.2 The Tech Boom Dynamics & Financial Market Exposures
The AI infrastructure boom has created a structural wedge between Asia’s technology producers and non-tech economies. Global capex in AI infrastructure has driven an export and capital investment surge across East and Southeast Asia:
- Hardware Exporters: Producers of advanced logic and high-bandwidth memory (HBM) chips—specifically Korea and Taiwan Province of China—have captured major terms-of-trade gains and surging corporate earnings. Assembling and packaging hubs such as Malaysia and Singapore have similarly captured strong intermediate demand flows.
- Data Center Build-Out: Domestic capital expenditure has been anchored by rapid data center construction. Operational and under-construction capacity has surged across primary regional nodes, creating downstream demand for intermediate inputs from regional suppliers in Thailand and Vietnam.
Concurrently, financial market vulnerabilities tied to the tech rally have escalated. Driven by AI sentiment, the MSCI Asia Tech Index surged significantly ahead of US technology stock indices through mid-2026. This equity concentration poses macroprudential risks: high leverage in tech capex financing, combined with intense valuation sensitivity, leaves regional financial centers vulnerable to abrupt market corrections if global AI monetization fails to meet high corporate earnings expectations.
1.3 Trade Realignment and Regional Integration
Despite high US effective tariffs, non-technology export growth rebounded sharply in the first half of 2026. Asian exporters have reoriented trade flows through expanding intra-Asian supply chains and deepening bilateral and multilateral trade architecture, with approximately 20 regional and inter-continental trade agreements entering into force during 2025–2026.
The prospective dividends of deeper trade integration remain exceptional. Empirical modeling demonstrates that systematically reducing non-tariff barriers (NTBs) across regional markets would boost total Asia-Pacific GDP by approximately 2 percent in the long run—an output gain equivalent to adding an economy the size of Thailand to the region.
These macro-level structural forces—energy adaptation costs, technology cycle exposures, and shifting trade networks—translate directly into highly divergent macroeconomic trajectories across individual Asian economies.
2. Country & Sub-Regional Macroeconomic Evaluations
The macroeconomic performance across Asia-Pacific economies reveals acute structural divergence. Tailoring national policy stances requires evaluating domestic exposures to tech cycles, energy import burdens, property sector realignments, and climate vulnerabilities.
2.1 Advanced Asia: Technology Leaders vs. Domestic Headwinds
- Korea: Real GDP growth accelerates sharply to 3.3 percent in 2026 (up from 1.1 percent in 2025), representing an upward revision of 1.4 percentage points. Korea stands as the primary beneficiary of the global AI upcycle, driven by global demand for HBM memory logic chips, with memory semiconductor export prices surging 173 percent year-over-year as of July 2026. Strong corporate earnings in the tech sector generated windfall corporate tax revenues. In currency markets, the Korean Won diverged significantly from the Japanese Yen, gaining 11 percent against the Yen between July 1 and September 3, 2026. This appreciation was driven by the onshore repatriation of tech export proceeds (including SK Hynix converting proceeds from an American Depository Receipt issuance) and a surge in Korea's current account surplus to an estimated 19 percent of GDP in 2026, offsetting foreign equity portfolio rebalancing outflows. Bank of Korea monetary policy has remained appropriately tight to manage positive output gaps, while fiscal policy maintains a neutral stance for 2026 as a whole, appropriately saving windfall corporate revenues to avoid adding to aggregate demand pressures.
- Japan: Growth is projected at 0.7 percent in 2026. Japanese performance reflects effective shock absorption through inventory drawdowns and targeted fiscal relief, which cushioned domestic consumption from energy price spikes. However, Japan's memory chip export mix captured a smaller share of the immediate AI windfall relative to Korea. The Japanese Yen experienced sustained weakness, with Japan's current account surplus (~4 percent of GDP) driven primarily by overseas investment income that is largely reinvested abroad rather than repatriated. Long-term sovereign yield curves shifted upward, with 10-year Japanese Government Bond (JGB) yields rising amid increased global term premia and domestic fiscal risk perceptions, prompting calibrated monetary adjustments by the Bank of Japan.
2.2 Emerging Engines: China and India
- China: Real GDP growth is forecast to moderate to 4.5 percent in 2026 (and 4.0 percent in 2027). The baseline is constrained by a protracted property sector slump, depressed domestic consumer confidence, and low inflation bordering on deflationary pressure. Net exports remain the principal growth driver, enabled by declining relative export prices.
Spillovers from Chinese industrial export prices affect the rest of Asia through two transmission channels:
- Intermediate Input Channel: Downstream manufacturers across Asia benefit from cheaper Chinese intermediate inputs (machinery, metals, chemicals), boosting production efficiency (+0.8 percent output gain over 4 years).
- Final Goods Competition Channel: Asian producers competing directly with Chinese final manufactured goods suffer margin compression and market share loss (-0.8 percent output drop over 3 years).
Across most economies, these two channels net out to a neutral aggregate impact. However, in downstream assembly hubs like Vietnam, the positive intermediate input channel dominates. To achieve internal rebalancing, we urge Chinese authorities to deploy a comprehensive property sector rehabilitation package—costing approximately 5 percent of GDP over three years to triage developers and ensure pre-sold unfinished housing is completed—complemented by near-term fiscal stimulus targeted at social safety nets and private consumption.
- India: Growth remains exceptionally strong, projected at 7.0 percent in 2026 and 2027, driven by robust private consumption and services activity. The disconnect between strong domestic growth and external market pressures—manifested in Rupee depreciation and foreign portfolio equity outflows—reflects global interest rate adjustments and elevated oil import costs. The flexible exchange rate has functioned effectively as a shock absorber. Furthermore, the methodology behind India's GDP national accounts rebasing by the Ministry of Statistics and Programme Implementation (MoSPI)—incorporating updated Producer Price Index (PPI) and Index of Industrial Production (IIP) weights—aligns fully with international statistical standards and accurately reflects structural shifts in India's industrial sector.
2.3 ASEAN Economies & Macro Stabilization Successes
- Vietnam: Real GDP growth reaches an impressive 8.4 percent in 2026 (up from 8.0 percent in 2025), marking a 1.3 percentage point upward revision. Vietnam has capitalized on supply-chain diversification, capturing foreign direct investment (FDI) and leveraging cheap intermediate inputs from China to power its electronics assembly sector.
- Indonesia: Growth holds steady at 5.1 percent in 2026. Macroeconomic fundamentals remain stable, supported by proactive monetary policy. Fiscal discipline is anchored by strict adherence to the statutory 3 percent of GDP budget deficit cap, preserving sovereign credibility.
- Thailand: Real GDP growth remains subdued at 2.1 percent in 2026, constrained by high energy intensity (energy use accounts for roughly 7 percent of GDP—among the highest in ASEAN) and elevated household debt burdens.
- Malaysia: As a net energy exporter, Malaysia maintains strong growth at 5.2 percent in 2026, advancing targeted fiscal consolidation while benefiting from elevated fuel prices and technology assembly demand.
- Sri Lanka: Demonstrating remarkable macroeconomic stabilization under its IMF-supported program, Sri Lanka achieved 11 consecutive quarters of positive real GDP growth through 2026. The domestic revenue-to-GDP ratio has doubled from crisis lows, sovereign debt restructuring is largely complete, and staff-level agreement was reached on the 7th review under the Extended Fund Facility (EFF) ahead of the program's scheduled March 2027 conclusion.
2.4 Low-Income Countries (LICs) and Pacific Island Countries (PICs)
Projections for vulnerable regional groupings have suffered severe downward revisions. LIC growth is projected at 3.7 percent in 2026 (down 0.7 percentage points from April WEO), while PIC growth is revised down to 2.6 percent. These vulnerable economies face compounding structural shocks:
- Bangladesh Specific Strains: Bangladesh faces acute stagflationary pressures, with headline inflation reaching 8.0 percent as of September 2026. Public balance sheets are under extreme strain, constrained by a tax revenue-to-GDP ratio of just 7.0 percent—one of the lowest in the world—which severely restricts fiscal space for social protection and essential infrastructure.
- Nepal Governance & Central Bank Independence: While navigating energy import inflation, Nepal faces critical institutional risks. Proposed amendments to the Nepal Rastra Bank (NRB) Act threaten central bank independence by shortening official terms for senior leadership and expanding direct government influence over monetary operations, undermining policy credibility.
- Extreme Climate Metrics (El Niño Super Cycle): Data metrics from the central-eastern equatorial Pacific (Niño 3.4 region) reveal sea surface temperatures exceeding 29.5°C—putting 2026 on track for the strongest El Niño on record. This climate shock has triggered severe agricultural yield failures, hydro-power disruptions, and surging shipping container fees, threatening food security and fiscal stability across low-income and Pacific Island communities.
These severe national and sub-regional vulnerabilities underscore the urgent need for structural economic transformations, which are analyzed in detail in the outlook's special analytical chapters.
3. Structural Themes
Sustaining long-term regional competitiveness and elevating potential growth requires addressing three key structural themes: labor market adaptation under artificial intelligence, unlocking domestic consumption through social protection reform, and deregulating services trade.
3.1 Labor Markets in the AI Era
Asia faces a acute demographic divide. Advanced economies (Japan, Korea) contend with rapidly aging populations and shrinking labor supplies, whereas emerging economies in South and Southeast Asia must absorb expanding youth cohorts. In several emerging markets, youth unemployment is disproportionately high, reaching nearly 30 percent for college graduates, with severe overeducation (e.g., nearly 70 percent of college graduates in the Philippines work in jobs that do not require a tertiary degree).
Empirical analysis tracking 40 million online job postings across 19 Asian economies reveals how generative AI is reshaping regional labor markets:
- Initial Labor Demand Shock: Following the release of generative AI tools, employer hiring demand in occupations highly exposed to AI (such as software coding) declined by approximately 10 percent relative to non-exposed occupations.
- Stabilization Mechanism: Remarkably, despite rapid advances in AI task capabilities—expanding from completing 9-second tasks to executing complex 12-hour programming workflows—the relative decline in labor demand stabilized.
- The Emerging Skill Pivot: This stabilization occurs because AI is reshaping work rather than simply destroying jobs. Employers are aggressively increasing job postings for workers possessing emerging AI skills—such as prompt engineering, Retrieval-Augmented Generation (RAG), and AI agent architecture. Rather than replacing human capital entirely, firms are seeking workers capable of leveraging AI to boost productivity.
3.2 Supporting Domestic Demand & Social Safety Nets
Private consumption across Emerging Asia remains structurally depressed, characterized by persistent consumption shortfalls relative to income growth and high household savings rates. Structural modeling indicates that high precautionary savings are driven by:
- Inadequate pension coverage and low old-age income replacement rates;
- High income uncertainty and widespread informal employment; and
- Minimal targeted social safety nets for out-of-work households.
Implementing fiscally sustainable social protection reforms—such as expanding pension coverage in aging societies and establishing targeted income support in informal economies—can systematically reduce precautionary savings motives. By mitigating catastrophic income risks, well-designed social safety nets unlock domestic consumption, providing a durable internal counterweight to volatile external trade conditions without undermining medium-term fiscal frameworks.
3.3 Asia-Pacific’s Next Integration Frontier: Services Trade
While Asia is a hyper-integrated global hub for merchandise trade, services trade integration lags significantly behind international benchmarks, accounting for only 25 percent of total regional exports due to domestic regulatory barriers and foreign entry caps.
Model simulations demonstrate that systematically reducing domestic regulatory barriers and easing foreign entry restrictions in modern services would generate substantial long-run real GDP and productivity gains. Unlocking modern services trade requires targeted investments in digital infrastructure, cross-border regulatory harmonization, and workforce reskilling.
Translating these structural analytical insights into policy requires concrete, authoritative directives for central banks, finance ministries, and financial regulators across the region.
4. Policy Directives, Risk Matrix, and Recommendations
To maintain macroeconomic stability and build long-term resilience amid severe global headwinds, regional policymakers must shift decisively from short-term emergency mitigation to systematic buffer rebuilding and structural transformation.
4.1 Macroeconomic & Financial Policy Guidance
- Monetary Policy Directives: We mandate that central banks maintain an uncompromising focus on price stability. Where oil price pass-through threatens second-round core inflation, demand pressures from tech booms remain elevated, or inflation expectations risk unanchoring (particularly in emerging markets like Bangladesh where inflation exceeds 8 percent), central banks must stand ready to tighten monetary policy further. Statutory central bank independence must be forcefully preserved; legislative proposals that compromise central bank autonomy—such as the draft amendments to the Nepal Rastra Bank Act—must be rejected to safeguard institutional credibility.
- Fiscal Policy Frameworks: We direct finance ministries to execute growth-friendly fiscal consolidation to stabilize elevated public debt ratios and rebuild depleted policy space. Governments must decisively replace broad-based fuel subsidies and price freezes with targeted, time-bound social protection delivered via digital cash transfers ("Protect People, Not Prices"). Subsidy regimes must be systematically phased out to restore market price signals, with consolidation anchored in transparent, medium-term fiscal frameworks.
- Financial Supervision & Regulatory Action: Financial supervisors must intensify oversight of corporate leverage, specifically regarding debt-financed tech capex and concentrated equity valuations. Stress testing must account for global term premia spikes, sovereign yield curve shocks, and rising non-performing loans (NPLs). To preserve digital financial stability, regulatory authorities across all jurisdictions must rapidly implement the "Bangkok Blueprint"—the joint IMF-World Bank-Bank of Thailand framework designed to combat cyber-enabled fraud in digital financial services.
4.2 Strategic Risk Matrix & Summary Framework
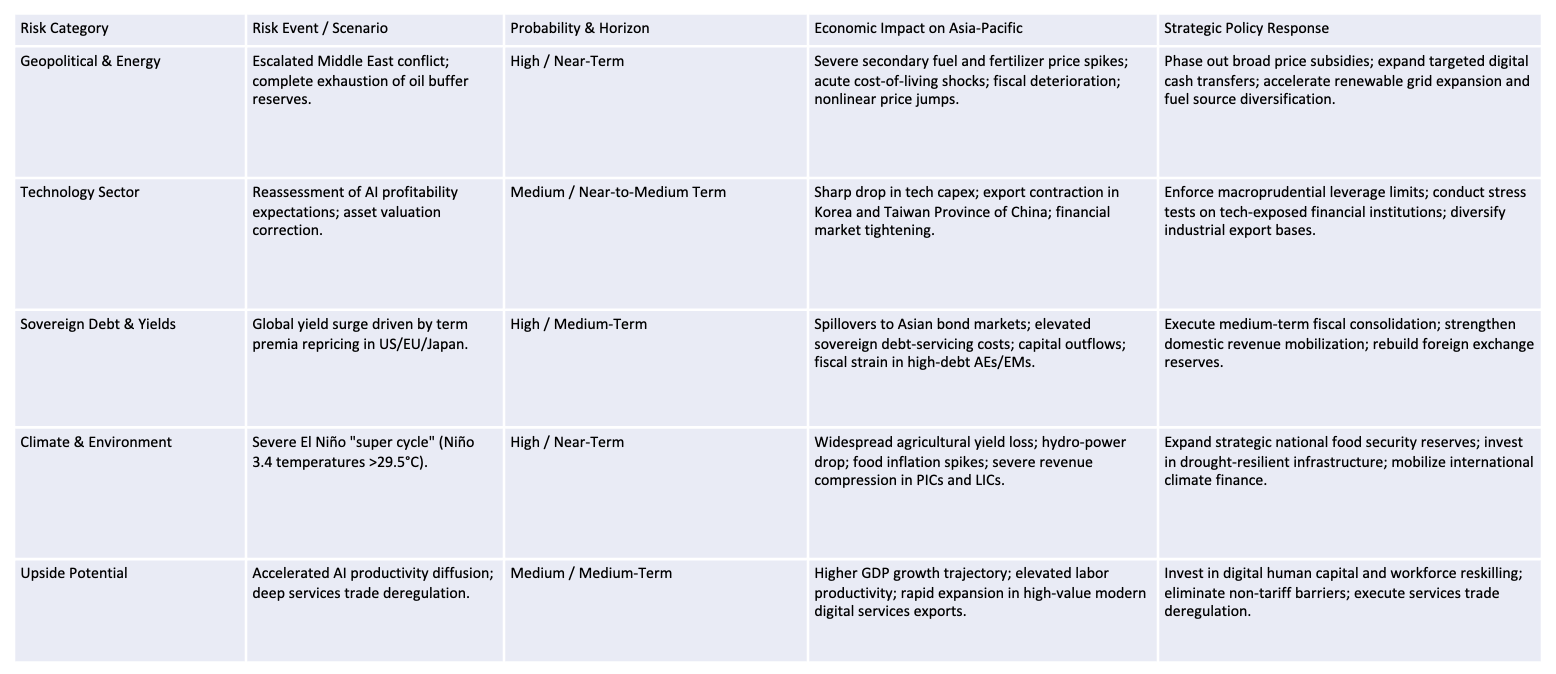
By maintaining strict monetary and fiscal discipline, executing targeted social protection, and accelerating structural reforms across labor, services, and green energy, the Asia-Pacific region will fortify its economic resilience and secure its position as the dynamic engine of global growth.
 Norbert Gehrke